Eversource 2000 Annual Report Download - page 2
Download and view the complete annual report
Please find page 2 of the 2000 Eversource annual report below. You can navigate through the pages in the report by either clicking on the pages listed below, or by using the keyword search tool below to find specific information within the annual report.-
 1
1 -
 2
2 -
 3
3 -
 4
4 -
 5
5 -
 6
6 -
 7
7 -
 8
8 -
 9
9 -
 10
10 -
 11
11 -
 12
12 -
 13
13 -
14
-
15
-
16
 |
 |

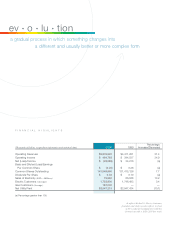
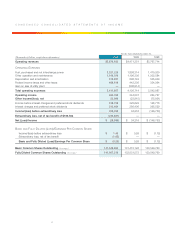
FINANCIAL HIGHLIGHTS
Percentage
(Thousands of Dollars, except share information and statistical data)
2000 1999 Increase/(Decrease)
Operating Revenues $5,876,620 $4,471,251 31.4
Operating Income $ 464,763 $ 344,537 34.9
Net (Loss)/Income $ (28,586) $ 34,216 (a)
Basic and Diluted (Loss)/Earnings
Per Common Share $ (0.20) $ 0.26 (a)
Common Shares Outstanding 141,549,860 131,415,126 7.7
Dividends Per Share $ 0.40 $ 0.10 (a)
Sales of Electricity (kWh - Millions) 75,660 66,848 13.2
Electric Customers (Average) 1,753,800 1,746,493 0.4
Gas Customers (Average) 187,000 ——
Net Utility Plant $3,547,215 $3,947,434 (10.1)
(a) Percentage greater than 100.
a different and usually better or more complex form
a gradual process in which something changes into
ev • o • lu • tion
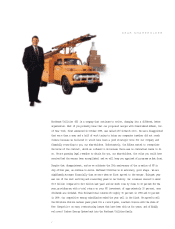
At right is Michael G. Morris, chairman,
president and chief executive officer, in front
of NU’s corporate headquarters in Berlin,
Connecticut with a 1953 CL&P line truck.