Eversource 2000 Annual Report Download - page 10
Download and view the complete annual report
Please find page 10 of the 2000 Eversource annual report below. You can navigate through the pages in the report by either clicking on the pages listed below, or by using the keyword search tool below to find specific information within the annual report.-
 1
1 -
 2
2 -
 3
3 -
 4
4 -
 5
5 -
 6
6 -
 7
7 -
 8
8 -
 9
9 -
 10
10 -
 11
11 -
 12
12 -
 13
13 -
 14
14 -
 15
15 -
 16
16
 |
 |

8
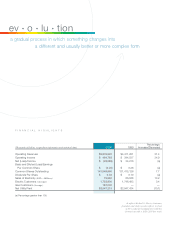
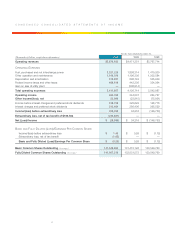
CONDENSED CONSOLIDATED STATEMENTS OF INCOME
For the Years Ended December 31,
(Thousands of Dollars, except share information)
2000 1999 1998
Operating revenues $5,876,620 $4,471,251 $3,767,714
OPERATING EXPENSES
Fuel, purchased and net interchange power 3,321,226 1,898,314 1,470,200
Other operation and maintenance 1,106,076 1,196,336 1,202,584
Depreciation and amortization 515,937 898,742 535,939
Federal income taxes and other taxes 468,618 442,236 334,264
Gain on sale of utility plant — (308,914) —
Total operating expenses 5,411,857 4,126,714 3,542,987
Operating income 464,763 344,537 224,727
Other income/(loss), net 53,996 (23,915) (75,951)
Income before interest charges and preferred stock dividends 518,759 320,622 148,776
Interest charges and preferred stock dividends 313,464 286,406 295,529
Income/(loss) before extraordinary loss 205,295 34,216 (146,753)
Extraordinary loss, net of tax benefit of $169,562 (233,881) ——
Net (Loss)/Income $ (28,586) $ 34,216 $ (146,753)
BASIC AND FULLY DILUTED (LOSS)/EARNINGS PER COMMON SHARE:
Income/(loss) before extraordinary loss $ 1.45 $ 0.26 $ (1.12)
Extraordinary loss, net of tax benefit (1.65) ——
Basic and Fully Diluted (Loss)/Earnings Per Common Share $ (0.20) $ 0.26 $ (1.12)
Basic Common Shares Outstanding (Average) 141,549,860 131,415,126 130,549,760
Fully Diluted Common Shares Outstanding (Average) 141,967,216 132,031,573 130,549,760