Equifax 2015 Annual Report Download - page 21
Download and view the complete annual report
Please find page 21 of the 2015 Equifax annual report below. You can navigate through the pages in the report by either clicking on the pages listed below, or by using the keyword search tool below to find specific information within the annual report.-
 1
1 -
2
-
3
-
4
-
5
-
6
-
7
-
8
-
9
-
10
-
 11
11 -
 12
12 -
 13
13 -
 14
14 -
 15
15 -
 16
16 -
 17
17 -
 18
18 -
 19
19 -
 20
20 -
 21
21 -
 22
22 -
 23
23 -
 24
24 -
 25
25 -
 26
26 -
 27
27 -
 28
28 -
 29
29 -
 30
30 -
 31
31 -
32
-
33
-
34
-
35
-
36
-
37
-
38
-
39
-
40
-
41
-
42
-
43
-
44
-
45
-
46
-
47
-
48
-
49
-
50
-
51
-
52
-
53
-
54
-
55
-
56
-
57
-
58
-
59
-
60
-
61
-
62
-
63
-
64
-
65
-
66
-
67
-
68
-
69
-
70
-
71
-
72
-
73
-
74
-
75
-
76
-
77
-
78
-
79
-
80
-
81
-
82
-
83
-
84
-
85
-
86
-
87
-
88
 |
 |

– 20 –
International Operating Margin. Operating margin decreased to 20.0% in 2015 as compared to 21.1% in 2014. The
decline primarily resulted from geographic and product mix, regionalization efforts, and investments in the U.K. Operating margin
decreased in 2014 as compared to 2013 due to recent acquisitions, including increased acquisition-related amortization expense
of $23.3 million in 2014, related to the recent acquisitions. The declines in margin were also a result of inflation-driven pressures
on margin in Argentina.
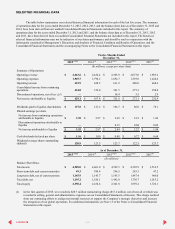
Workforce Solutions
Twelve Months Ended December 31, Change
2015 vs. 2014 2014 vs. 2013
Workforce Solutions 2015 2014 2013 $ % $ %
(Inmillions)
Operating Revenue:
Verification Services $364.4 $292.6 $279.3 $71.8 25 %$13.3 5 %
Employer Services 213.3 197.5 194.8 15.8 8 %2.7 1 %
Total operating revenue $577.7 $490.1 $474.1 $87.6 18 %$16.0 3 %
% of consolidated revenue 22%20%21%
Total operating income $218.8 $160.7 $142.6 $58.1 36 %$18.1 13 %
Operating margin 37.9%32.8%30.1%5.1pts 2.7pts
Verification Services. Revenue increased 25% in 2015 compared to prior year, due to strong growth in mortgage, auto,
pre-employment screening and government verticals, and continued addition of new records to The Work Number database.
Revenue increased 5% in 2014 compared to prior year, due to strong growth in non-mortgage verticals, which was partially
offset by the expected decline in mortgage-related verification revenue in 2014 driven by the anticipated decline in mortgage
market activity in 2014. The revenue growth in non-mortgage verticals was primarily a result of increased revenue mostly related
to government, pre-employment and auto segments.
Employer Services. Revenue grew 8% in 2015, as compared to 2014. Revenue growth was due to continued higher
employment based tax credit activity due to the delayed approval of the Federal Work Opportunity Tax Credit program for
2014, as well as growth in our employer-based compliance solutions and workforce analytics business.
Revenue grew 1% in 2014, as compared to 2013. Revenue growth was due to growth in our transaction-based services
business and workforce analytics business. The growth in 2014 was partially offset by lower unemployment claims activity and
a decline in revenue related to the non-renewal of the Federal Work Opportunity Tax Credit program in 2014.
Workforce Solutions Operating Margin. Operating margin increased 510 basis points to 37.9% in 2015 as compared
to 32.8% in 2014. Margin expansion in 2015 was driven by product mix, as well as strong revenue growth in 2015. Operating
margin for 2014 increased to 32.8% compared to 30.1% in prior year. Margin expansion in 2014 was driven by a higher mix of
high margin business compared to 2013, as well as cost management initiatives executed during the year. Margin improvement
was also driven by lower acquisition-related amortization due to certain purchased intangible assets related to our TALX
Corporation acquisition in 2007 that became fully amortized during the second quarter of 2013.
37
CONTENTS