Equifax 2015 Annual Report Download - page 20
Download and view the complete annual report
Please find page 20 of the 2015 Equifax annual report below. You can navigate through the pages in the report by either clicking on the pages listed below, or by using the keyword search tool below to find specific information within the annual report.-
 1
1 -
2
-
3
-
4
-
5
-
6
-
7
-
8
-
9
-
 10
10 -
 11
11 -
 12
12 -
 13
13 -
 14
14 -
 15
15 -
 16
16 -
 17
17 -
 18
18 -
 19
19 -
 20
20 -
 21
21 -
 22
22 -
 23
23 -
 24
24 -
 25
25 -
 26
26 -
 27
27 -
 28
28 -
 29
29 -
 30
30 -
31
-
32
-
33
-
34
-
35
-
36
-
37
-
38
-
39
-
40
-
41
-
42
-
43
-
44
-
45
-
46
-
47
-
48
-
49
-
50
-
51
-
52
-
53
-
54
-
55
-
56
-
57
-
58
-
59
-
60
-
61
-
62
-
63
-
64
-
65
-
66
-
67
-
68
-
69
-
70
-
71
-
72
-
73
-
74
-
75
-
76
-
77
-
78
-
79
-
80
-
81
-
82
-
83
-
84
-
85
-
86
-
87
-
88
 |
 |

– 19 –
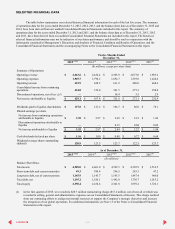
International
Twelve Months Ended December 31, Change
2015 vs. 2014 2014 vs. 2013
International 2015 2014 2013 $ % $ %
(Inmillions)
Operating revenue:
Europe $246.5 $242.4 $160.2 $4.1 2 %$82.2 51 %
Latin America $199.6 $192.2 $194.3 $7.4 4 %$(2.1)(1)%
Canada 122.4 137.6 143.3 (15.2)(11)% (5.7)(4)%
Total operating revenue $568.5 $572.2 $497.8 $(3.7)(1)% $74.4 15 %
% of consolidated revenue 21%23%22%
Total operating income $113.5 $121.0 $145.3 $(7.5)(6)% $(24.3)(17)%
Operating margin 20.0%21.1%29.2%(1.1)pts (8.1)pts
International revenue decreased by 1% in 2015 as compared to 2014. Local currency international revenue increased
by 12% in 2015 as compared to prior year, as a result of growth across many geographies, including solid growth in Argentina
and the U.K., compared to prior year. Local currency fluctuations against the U.S. dollar negatively impacted revenue by $70.5
million, or 13%.
International revenue increased by 15% in 2014 as compared to 2013. Local currency international revenue increased
by 22% in 2014 as compared to prior year. Local currency revenue grew 17% as a result of our first quarter 2014 acquisition of
TDX and our fourth quarter 2013 acquisitions in Paraguay and Mexico. Local currency revenue increased 5% due to organic
growth across the geographies, primarily the U.K., Argentina, and Canada. Local currency fluctuations against the U.S. dollar
negatively impacted revenue by $35.6 million, or 7%.
Europe. Local currency revenue growth was 12% in 2015 primarily due to increased revenue in the U.K. across most
verticals. Local currency fluctuations against the U.S. dollar negatively impacted revenue by $25.8 million, or 10%, for 2015.
Reported revenue increased 2% in 2015.
Local currency revenue growth was 44% in 2014 primarily due to the acquisition of TDX in the first quarter of 2014
which represented 39 percentage points of the growth in 2014. The remaining 5 percentage points of the growth were driven by
increased revenue in the U.K. across most product segments, despite continued challenging economic conditions. Local
currency fluctuations against the U.S. dollar positively impacted revenue by $11.7 million, or 7%, for 2014. Reported revenue
increased 51% in 2014.
Latin America. Local currency revenue increased 17% in 2015 driven by core organic growth primarily in Argentina.
Local currency fluctuations against the U.S. dollar negatively impacted revenue by $25.5 million, or 13%, in 2015, most
notably due to depreciation in the foreign exchange rate of the Argentine peso and the Chilean peso. Reported revenue
increased 4% in 2015.
Local currency revenue increased 18% in 2014 driven by growth in Argentina, Peru, Chile, Uruguay and Ecuador.
Approximately half of this growth was organic growth in Argentina and other countries, while the other half resulted from the
fourth quarter 2013 acquisitions in Paraguay and Mexico. Local currency fluctuations against the U.S. dollar negatively
impacted revenue by $37.4 million, or 19%, in 2014, most notably due to depreciation in the foreign exchange rate of the
Argentine peso. Reported revenue decreased 1% in 2014.
Canada. Local currency revenue increased 3% in 2015 compared to 2014, primarily due to growth within
information and analytical services. Local currency fluctuations against the U.S. dollar negatively impacted revenue by $19.2
million, or 14%, in 2015. Reported revenue decreased 11% in 2015.
Local currency revenue increased 3% in 2014 compared to 2013, primarily due to new customers within marketing
and decision solutions, as well as, growth in information services. Local currency fluctuations against the U.S. dollar
negatively impacted revenue by $9.9 million, or 7%, in 2014. Reported revenue decreased 4% in 2014.
36
CONTENTS