Einstein Bros 2004 Annual Report Download - page 16
Download and view the complete annual report
Please find page 16 of the 2004 Einstein Bros annual report below. You can navigate through the pages in the report by either clicking on the pages listed below, or by using the keyword search tool below to find specific information within the annual report.-
 1
1 -
2
-
3
-
4
-
5
-
 6
6 -
 7
7 -
 8
8 -
 9
9 -
 10
10 -
 11
11 -
 12
12 -
 13
13 -
 14
14 -
 15
15 -
 16
16 -
 17
17 -
 18
18 -
 19
19 -
 20
20 -
 21
21 -
 22
22 -
 23
23 -
 24
24 -
 25
25 -
 26
26 -
27
-
28
-
29
-
30
-
31
-
32
-
33
-
34
-
35
-
36
-
37
-
38
-
39
-
40
-
41
-
42
-
43
-
44
-
45
-
46
-
47
-
48
-
49
-
50
-
51
-
52
-
53
-
54
-
55
-
56
-
57
-
58
-
59
-
60
-
61
-
62
-
63
-
64
-
65
 |
 |

http://www.sec.gov/Archives/edgar/data/949373/000104746905006202/a2153240z10-k.htm[9/11/2014 10:13:29 AM]
As reported $ (175,330) $ (67,708) $ (14,423) (82,131) $ (21.20)$ (257,461)
Adjustments (7,474) (5,813) — (5,813) (1.51) (13,287)
As restated $ (182,804) $ (73,521) $ (14,423) $ (87,944) $ (22.71)$ (270,748)
We expect that in future years, depreciation and amortization will increase by approximately $1.0 million per year assuming stable levels of
capital expenditures going forward. The following management's discussion and analysis takes into account the effects of these adjustments.
Company Overview
We are a leader in the quick casual segment of the restaurant industry. We specialize in high-quality foods for breakfast and lunch in a café
atmosphere with a neighborhood emphasis. Our product offerings include fresh baked goods, made-to-order sandwiches, bagels, soups, salads,
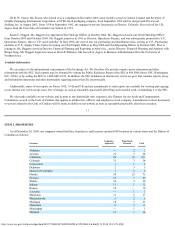
desserts, premium coffees and other café beverages. With 690 locations in 34 states and in the District of Columbia as of December 28, 2004, we
operate and license locations primarily under the Einstein Bros. and Noah's brand names, and franchise locations primarily under the Manhattan
and Chesapeake brand names. We also operate a dough production facility. We view our business as a single segment with a focus on our
company-operated restaurants. Our manufacturing and franchise operations are either supportive or ancillary to our main business focus.
Industry Overview
Demographic shifts and evolving lifestyles have affected the U.S. restaurant industry over the past 30 years. The growth of women in the
workforce, the resulting rise of dual income households, and a large decrease in blue collar jobs and corresponding increase in white collar
employment means consumers find themselves pressed for time, but not for money. Less time, more money, different jobs and fewer stay-at-home
cooks all continue to drive changes in food consumption habits in America.
18
According to Technomic, Inc., a food service consulting company, the U.S. foodservice industry (i.e., food consumed outside the home) accounted
for approximately 49% of total food sales in 2004, up from 37% in 1975. These demographic shifts and evolving lifestyles have more recently
given rise to the "quick casual" segment of the restaurant industry. This is the segment in which our brands compete. As defined by Technomic,
quick casual restaurants are "attractive and comfortable establishments that serve freshly prepared, wholesome, quality, authentic foods in
reasonably fast service formats."
Trends and/or Uncertainties
The following factors represent currently known trends or uncertainties that may impact the comparability of operating performance or could
cause reported financial information not to be necessarily indicative of future operating results or future financial condition.
Revenue Trends and/or Uncertainties
We believe that a combination of events, including the popularity of lower carbohydrate diets and the constant competitive pressure of the
restaurant industry, resulted in negative comparable store sales for the first three quarters of the fiscal year ended 2004. We believe that changes in
the products sold at our restaurants, including new menu items that are lower in fat and carbohydrate content, coupled with operational changes at
several of our restaurants, contributed to positive comparable store sales in the fourth fiscal quarter of 2004. We are also utilizing our marketing
programs to continue building awareness of our lunch offerings and to increase consumer visits to our restaurants.
As previously discussed, we opened our first EB Café on October 18, 2004 in the Denver, Colorado market. By the end of fiscal year 2004,
we retrofitted four additional Einstein Bros. Bagel restaurants in the Denver and Colorado Springs, Colorado markets to EB Cafés. We plan to
gather financial and other data following the conversion of these restaurants to EB Cafés and analyze this information to determine the nature and
extent of modifications to the menu offerings, physical layout, operating elements and design elements for future conversions. Once we have
completed our design and operating modification plan, we intend to commence a staggered rollout over approximately a three-year time frame to
other markets beginning in 2005. We believe that by converting our Einstein Bros. restaurants to EB Cafés on a market-by-market basis, we can
develop a consistent marketing and advertising message to our customers. Additionally, we believe we can minimize the adverse impact that
supporting multiple brands within the same market would have on our distribution partners.
Expense Trends and/or Uncertainties