EasyJet 2011 Annual Report Download - page 23
Download and view the complete annual report
Please find page 23 of the 2011 EasyJet annual report below. You can navigate through the pages in the report by either clicking on the pages listed below, or by using the keyword search tool below to find specific information within the annual report.-
 1
1 -
2
-
3
-
4
-
5
-
6
-
7
-
8
-
9
-
10
-
11
-
12
-
 13
13 -
 14
14 -
 15
15 -
 16
16 -
 17
17 -
 18
18 -
 19
19 -
 20
20 -
 21
21 -
 22
22 -
 23
23 -
 24
24 -
 25
25 -
 26
26 -
 27
27 -
 28
28 -
 29
29 -
 30
30 -
 31
31 -
 32
32 -
 33
33 -
34
-
35
-
36
-
37
-
38
-
39
-
40
-
41
-
42
-
43
-
44
-
45
-
46
-
47
-
48
-
49
-
50
-
51
-
52
-
53
-
54
-
55
-
56
-
57
-
58
-
59
-
60
-
61
-
62
-
63
-
64
-
65
-
66
-
67
-
68
-
69
-
70
-
71
-
72
-
73
-
74
-
75
-
76
-
77
-
78
-
79
-
80
-
81
-
82
-
83
-
84
-
85
-
86
-
87
-
88
-
89
-
90
-
91
-
92
-
93
-
94
-
95
-
96
-
97
-
98
-
99
-
100
-
101
-
102
-
103
-
104
-
105
-
106
-
107
-
108
 |
 |
easyJet plc
Annual report
and accounts 2011
Overview Business review Performance and risk Corporate responsibility Governance Accounts & other information
21
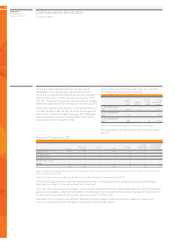
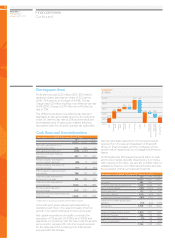
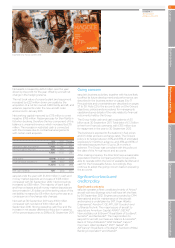
Exchange rates
Capacity growth in the year of 6.5 million seats flown,
around two-thirds was deployed in bases outside the
UK, resulting in the following exposures to foreign
currency:
Revenue Costs
2011 2010 2011 2010
Sterling 47% 48% 24% 27%
Euro 44% 44% 35% 34%
US dollar ––35% 33%
Other
(principally Swiss franc) 9% 8% 6% 6%
Average exchange rates
2011 2010 Change
Euro €1.15 €1.15 nil
US dollar
(sterling weaker) $1.61 $1.64 -1.8%
Swiss franc
(sterling weaker)
CHF
1.45
CHF
1.64 -11.6%
Although a substantial proportion of both revenue and
costs is denominated in euros, there was no change
year-on-year in the euro exchange rate, and hence no
impact on the reported result. The impact of changes
in the Swiss franc and US dollar were.
Favourable / (adverse)
Swiss franc US dollar Total
£ million £ million £ million
Revenue 24 – 24
Fuel – (17) (17)
Costs excluding fuel (21) (8) (29)
Total 3 (25) (22)
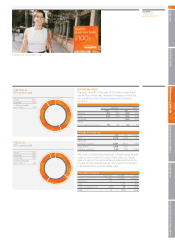
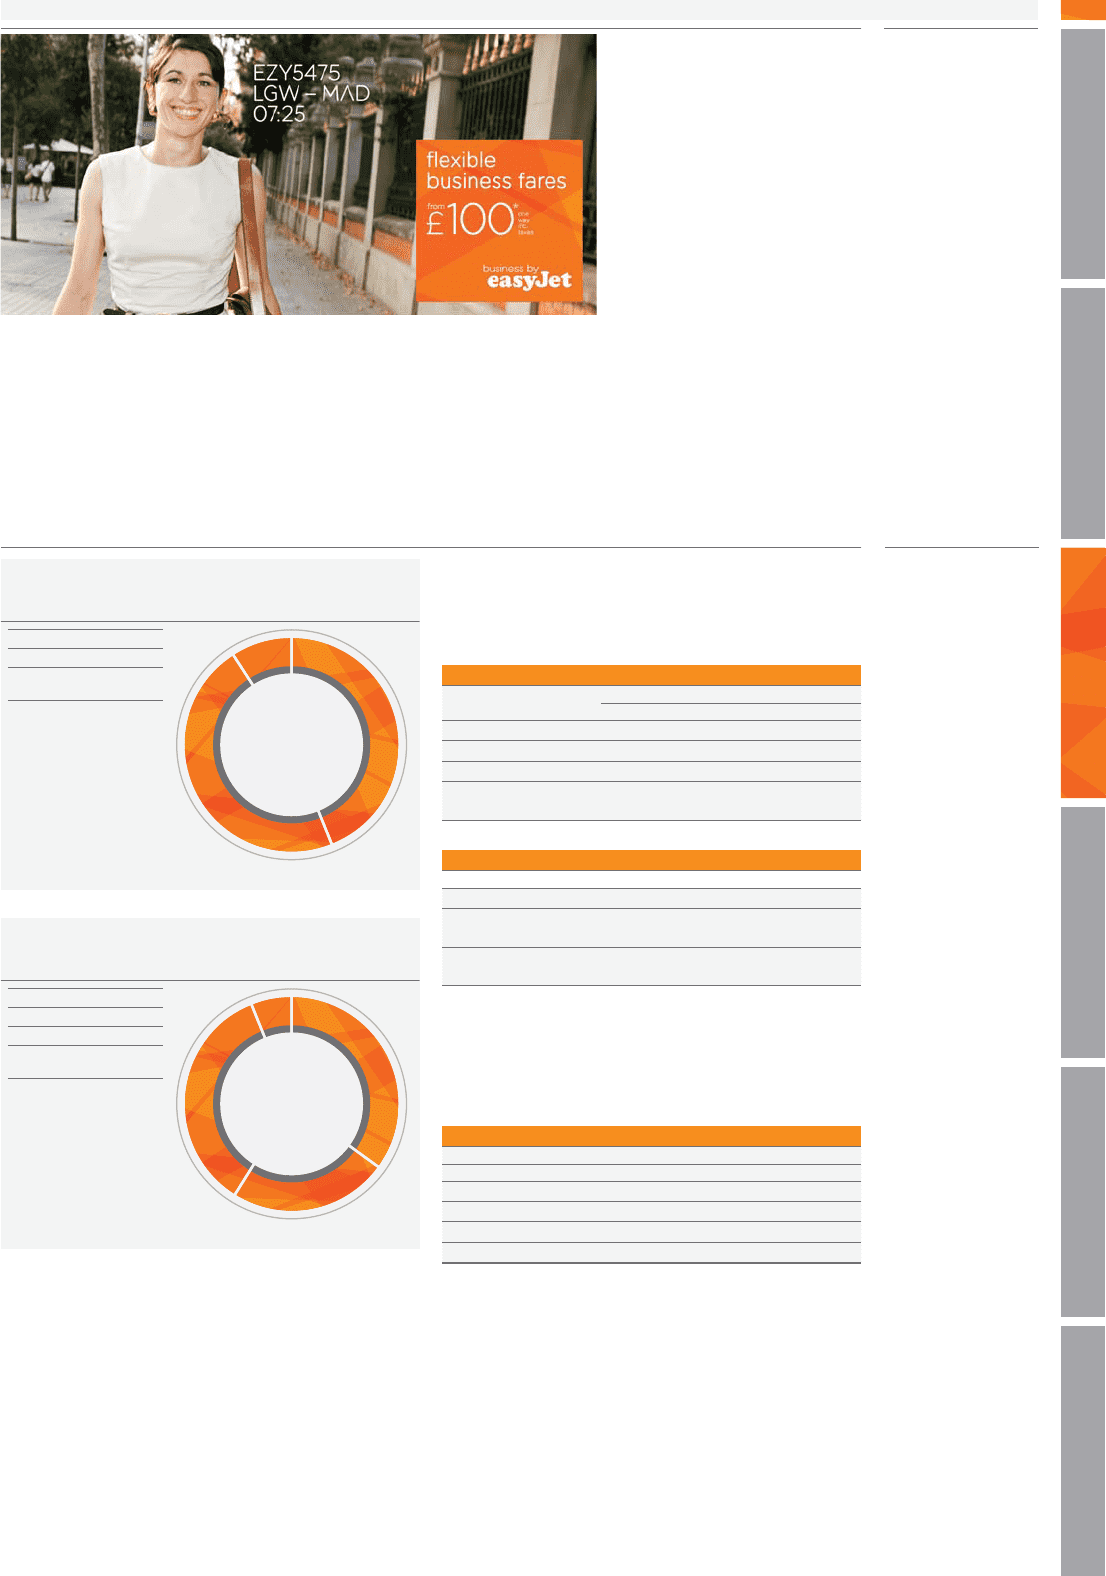
A euro 35%
B sterling 24%
C US dollar 35%
D other (principally
swiss franc) 6%
A
C
B
2011 currency split
Total costs
D
A euro 44%
B sterling 47%
C other (principally
swiss franc) 9%
A
C
B
2011 currency split
Total revenue
Example only. Not a current offer.