EasyJet 2011 Annual Report Download - page 22
Download and view the complete annual report
Please find page 22 of the 2011 EasyJet annual report below. You can navigate through the pages in the report by either clicking on the pages listed below, or by using the keyword search tool below to find specific information within the annual report.-
 1
1 -
2
-
3
-
4
-
5
-
6
-
7
-
8
-
9
-
10
-
11
-
 12
12 -
 13
13 -
 14
14 -
 15
15 -
 16
16 -
 17
17 -
 18
18 -
 19
19 -
 20
20 -
 21
21 -
 22
22 -
 23
23 -
 24
24 -
 25
25 -
 26
26 -
 27
27 -
 28
28 -
 29
29 -
 30
30 -
 31
31 -
 32
32 -
33
-
34
-
35
-
36
-
37
-
38
-
39
-
40
-
41
-
42
-
43
-
44
-
45
-
46
-
47
-
48
-
49
-
50
-
51
-
52
-
53
-
54
-
55
-
56
-
57
-
58
-
59
-
60
-
61
-
62
-
63
-
64
-
65
-
66
-
67
-
68
-
69
-
70
-
71
-
72
-
73
-
74
-
75
-
76
-
77
-
78
-
79
-
80
-
81
-
82
-
83
-
84
-
85
-
86
-
87
-
88
-
89
-
90
-
91
-
92
-
93
-
94
-
95
-
96
-
97
-
98
-
99
-
100
-
101
-
102
-
103
-
104
-
105
-
106
-
107
-
108
 |
 |

20
easyJet plc
Annual report
and accounts 2011
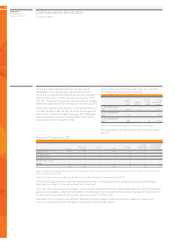
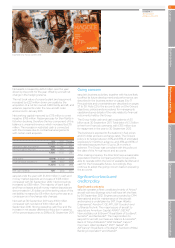
Operational measures
2011 2010 Change
Seats flown (millions) 62.5 56.0 11.5%
Passengers (millions) 54.5 48.8 11.8%
Load factor 87.3% 87.0% +0.3ppt
Available Seat Kilometres (ASK) (millions) 69,318 62,945 10.1%
Revenue Passenger Kilometres (RPK) (millions) 61,347 56,128 9.3%
Average sector length (kilometres) 1,110 1,123 (1.2)%
Sectors 393,147 353,080 11.3%
Block hours 761,708 689,316 10.5%
Number of aircraft owned/leased at end of year 204 196 4.1%
Average number of aircraft owned/leased during year 198.8 187.9 5.8%
Number of aircraft operated at end of year 197 186 5.9%
Average number of aircraft operated during year 185.4 174.9 6.0%
Operated aircraft utilisation (hours per day) 11.3 10.8 4.2%
Number of routes operated at end of year 547 509 7.5%
Number of airports served at end of year 123 125 (1.6)%
Financial measures
2011 2010 Change
Return on equity 14.0% 8.6% +5.4ppt
Return on capital employed 12.7% 8.8% +3.9ppt
Underlying measures
Profit before tax per seat (£) 3.97 3.36 17.9%
Profit before tax per ASK (pence) 0.36 0.30 20.9%
Revenue
Revenue per seat (£) 55.27 53.07 4.1%
Revenue per seat at constant currency (£) 54.87 53.07 3.4%
Revenue per ASK (pence) 4.98 4.72 5.4%
Revenue per ASK at constant currency (pence) 4.94 4.72 4.7%
Costs
Per seat measures
Total cost per seat (£) 51.30 49.71 3.2%
Total cost per seat excluding fuel (£) 36.62 36.62 Flat
Total cost per seat excluding fuel at constant currency (£) 36.15 36.62 (1.3)%
Operational cost per seat (£) 47.78 46.13 3.6%
Operational cost per seat excluding fuel (£) 33.10 33.04 0.2%
Operational cost per seat excluding fuel at constant currency (£) 32.75 33.04 (0.9)%
Ownership cost per seat (£) 3.52 3.58 (1.6)%
Per ASK measures
Total cost per ASK (pence) 4.62 4.43 4.2%
Total cost per ASK excluding fuel (pence) 3.30 3.26 1.2%
Total cost per ASK excluding fuel at constant currency (pence) 3.26 3.26 Flat
Operational cost per ASK (pence) 4.30 4.11 4.7%
Operational cost per ASK excluding fuel (pence) 2.98 2.94 1.3%
Operational cost per ASK excluding fuel at constant currency (pence) 2.95 2.94 0.3%
Ownership cost per ASK (pence) 0.32 0.32 Flat
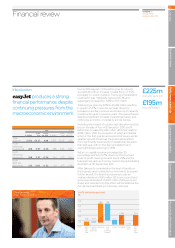
Financial review
Continued