EasyJet 2011 Annual Report Download - page 21
Download and view the complete annual report
Please find page 21 of the 2011 EasyJet annual report below. You can navigate through the pages in the report by either clicking on the pages listed below, or by using the keyword search tool below to find specific information within the annual report.-
 1
1 -
2
-
3
-
4
-
5
-
6
-
7
-
8
-
9
-
10
-
 11
11 -
 12
12 -
 13
13 -
 14
14 -
 15
15 -
 16
16 -
 17
17 -
 18
18 -
 19
19 -
 20
20 -
 21
21 -
 22
22 -
 23
23 -
 24
24 -
 25
25 -
 26
26 -
 27
27 -
 28
28 -
 29
29 -
 30
30 -
 31
31 -
32
-
33
-
34
-
35
-
36
-
37
-
38
-
39
-
40
-
41
-
42
-
43
-
44
-
45
-
46
-
47
-
48
-
49
-
50
-
51
-
52
-
53
-
54
-
55
-
56
-
57
-
58
-
59
-
60
-
61
-
62
-
63
-
64
-
65
-
66
-
67
-
68
-
69
-
70
-
71
-
72
-
73
-
74
-
75
-
76
-
77
-
78
-
79
-
80
-
81
-
82
-
83
-
84
-
85
-
86
-
87
-
88
-
89
-
90
-
91
-
92
-
93
-
94
-
95
-
96
-
97
-
98
-
99
-
100
-
101
-
102
-
103
-
104
-
105
-
106
-
107
-
108
 |
 |

easyJet plc
Annual report
and accounts 2011
Overview Business review Performance and risk Corporate responsibility Governance Accounts & other information
19
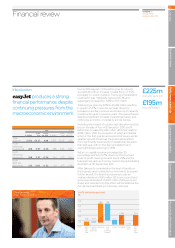
Introduction
easyJet produces a strong
financial performance despite
continuing pressures from the
macroeconomic environment.
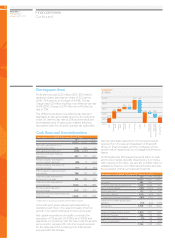
During 2011 easyJet continued to grow its network
successfully with an increase in seats flown of 11.5%,
principally in London Gatwick, France and Switzerland.
Load factor was marginally higher at 87.3% and
passengers increased by 11.8% to 54.5 million.
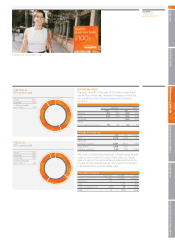
Total revenue grew by 16.1% to £3,452 million resulting
in growth of 4.1% in revenue per seat, driven by
increases in ancillary revenue and maturing of capacity
investments made in previous years. This was achieved
despite a significant increase in passenger taxes, and
continuing economic uncertainty across Europe.
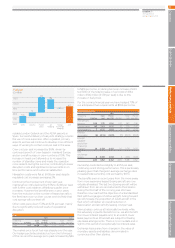
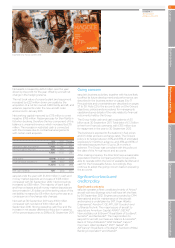
Excluding the impact of volcanic ash disruption and the
loss on the sale of four A321 aircraft in 2010, profit
before tax increased by £60 million (£0.61 per seat) to
£248 million. With the exception of external industrial
action in the first quarter and a period of severe winter
weather around Christmas, the business benefited
from significantly lower levels of operational disruption
than last year, with on the day cancellations and
overnight delays reducing by 46%.
Return on capital employed increased by 3.9
percentage points to 12.7%, driven by the improved
levels of profit. Gearing remains low at 28% and the
business had cash and money market deposits totalling
£1.4 billion at 30 September 2011.
After taking into consideration the level of liquidity in
the business, and contracted commitments to acquire
further aircraft, the Board is proposing to pay an
ordinary dividend of £45 million (10.5 pence per share)
and a special dividend of £150 million (34.9 pence per
share) and resolutions to this effect will be tabled at the
Annual General Meeting in February next year.
Financial review
Chris Kennedy
Chief Financial Officer
£225m
Profit after tax for 2011
£195m
Proposed dividend
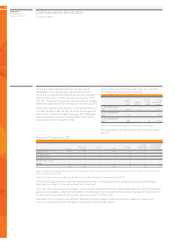
2011 2010
£ million
£ per
seat
Pence
per ASK £ million
£ per
seat
Pence
per ASK
Tota l
revenue 3,452 55.27 4.98 2,973 53.07 4.72
Profit
before tax
(underlying) 248 3.97 0.36 188 3.36 0.30
Profit
before tax
(reported) 248 3.97 0.36 154 2.75 0.24
Profit
aftertax
(reported) 225 3.60 0.32 121 2.17 0.19
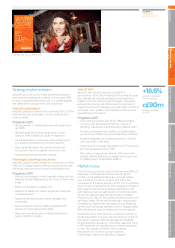
5.5
5.0
4.5
4.0
3.5
3.0
Profit before tax per seat
%
1.59
0.41
1.80
0.88 3.97
0.00
3.36 0.07
Fuel
(inc
currency
impact)
CrewRevenue Disruption 2011
PBT
per
seat
Other
costs
2010
PBT
per
seat
Currency
impact
(exc fuel)