Dow Chemical 2014 Annual Report Download - page 18
Download and view the complete annual report
Please find page 18 of the 2014 Dow Chemical annual report below. You can navigate through the pages in the report by either clicking on the pages listed below, or by using the keyword search tool below to find specific information within the annual report.
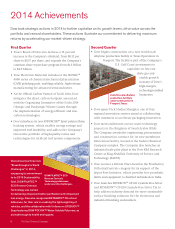
Dow’s strong earnings performance in 2014 resulted in a number
of record achievements and enabled us to accelerate our
1 by
25 percent and reported record adjusted EBITDA2 of $9.3 billion
consistent pattern of strong performance, we announced two
dividend increases and expanded our share repurchase program
from the completed $4.5 billion to a total of $9.5 billion.
Disciplined Actions to
Reward Shareholders
➔ Disciplined Execution
$1 billion in productivity actions
over the next three years
➔ Focus on Rewarding
Shareholders
19 percent increase in our dividend
on a compound basis since 2009
Discipline Reaps Rewards
Collectively, we continue to pull
strategic, operational and financial
levers to navigate market uncertainty
and to deliver increasing year-over-
year results. Since 2012, we have
streamlined the enterprise, enhanced
Continuous Improvement
Dow continues to maintain a strong
balance sheet. In 2014, we generated
a record $6.5 billion in cash flow from
operations, excluding the K-Dow
award. The Company’s ongoing
focus on growth in targeted markets,
productivity and margin expansion
resulted in a more than $320 million
increase versus 2013 — representing a
second consecutive year of record cash
flow from operations on this basis.
Long term, we anticipate stronger
cash flow. In addition to a significant
increase in cash flow due to higher
earnings, organic growth and key
growth catalysts, including our
investments in Sadara and on the
U.S. Gulf Coast, we expect to generate
$7 billion to $8.5 billion in proceeds
from divestitures by mid-2016. At the
same time, capital expenditures will
begin to decrease after 2015 as these
growth projects come on-line.
our return on capital and delivered
solid growth. In addition, our scale,
portfolio diversification and growth
catalysts support our mission to
deliver superior and reliable returns
over the long term.
16 The Dow Chemical Company
1
2
3
divided by Average Total Capital.
4
Increasing Adjusted ROC3
~300 bps Improvement
4Q
12
1Q 2Q
2013 2014
3Q 4Q 1Q 2Q 3Q 4Q
12%
10%
11%
8%
9%
0
7%
Trailing Twelve Months
4Q
12
1Q 2Q
2013 2014
3Q 4Q 1Q 2Q 3Q 4Q
Adjusted EBITDA Margin4 Expansion
~300 bps Improvement
20%
14%
15%
0
13%
16%
17%
18%
19%
Trailing Twelve Months
Adjusted EPS Growth
(dollars per share)
4Q
12
3
3.5
2
2.5
1.5
0
28% CAGR
1Q 2Q
2013 2014
3Q 4Q 1Q 2Q 3Q 4Q
Trailing Twelve Months
Adjusted EBITDA Growth
(dollars in billions)
12% CAGR
4Q
12
1Q 2Q
2013 2014
3Q 4Q 1Q 2Q 3Q 4Q
10
8
8.5
0
9
9.5
7
7.5
Trailing Twelve Months


