Dominion Power 2003 Annual Report Download - page 9
Download and view the complete annual report
Please find page 9 of the 2003 Dominion Power annual report below. You can navigate through the pages in the report by either clicking on the pages listed below, or by using the keyword search tool below to find specific information within the annual report.-
 1
1 -
 2
2 -
 3
3 -
 4
4 -
 5
5 -
 6
6 -
 7
7 -
 8
8 -
 9
9 -
 10
10 -
 11
11 -
 12
12 -
 13
13 -
 14
14 -
 15
15 -
 16
16 -
 17
17 -
 18
18 -
 19
19 -
 20
20 -
21
-
22
-
23
-
24
-
25
-
26
-
27
-
28
-
29
-
30
-
31
-
32
-
33
-
34
-
35
-
36
-
37
-
38
-
39
-
40
-
41
-
42
-
43
-
44
-
45
-
46
-
47
-
48
-
49
-
50
-
51
-
52
-
53
-
54
-
55
-
56
-
57
-
58
-
59
-
60
-
61
-
62
-
63
-
64
-
65
-
66
-
67
-
68
-
69
-
70
-
71
-
72
-
73
-
74
-
75
-
76
-
77
-
78
-
79
-
80
-
81
-
82
-
83
-
84
-
85
-
86
-
87
-
88
-
89
-
90
-
91
-
92
-
93
-
94
-
95
-
96
-
97
-
98
-
99
-
100
-
101
-
102
-
103
-
104
 |
 |

80
60
40
20
0
-20
-40
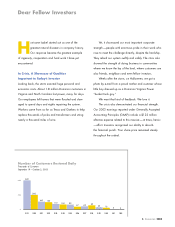
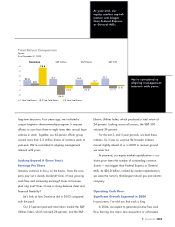
21.4
8.2
73.8
26.2
(38.5)
(12.2)
24.0
(12.3)
12.7
28.7
(11.7)
(2.8)
1 Year Total Return 3 Year Total Return 5 Year Total Return
Total Return Comparison
Percent
As of December 31, 2003
Dominion S&P Utilities S&P Electric S&P 500
We’re committed to
aligning management
interests with yours.
7.Dominion 2003
long-term decisions. Four years ago, we instituted a
unique long-term share-ownership program. It requires
officers to own from three to eight times their annual base
salaries in stock. Together, our 62-person officer group
owned more than 2.2 million shares of common stock at
year-end. We’re committed to aligning management
interests with yours.
Looking Beyond A Given Year’s
Earnings Per Share
Investors continue to focus on the basics. Does the com-
pany pay out a steady dividend?Does it have growing
cash flow and increasing earnings?Does its business
plan ring true?Does it have a strong balance sheet and
financial flexibility?
Let’s look at how Dominion did in 2003 compared
with the pack.
Our 21-percent year-end total return trailed the S&P
Utilities Index, which returned 26 percent, and the S&P
At year-end, our
equity market capital-
ization was bigger
than Federal Express
or General Mills.
Electric Utilities Index, which produced a total return of
24 percent. Looking across all sectors, the S&P 500
returned 29 percent.
For the last 3- and 5-year periods, we beat these
indexes. So it was no surprise the broader indexes
moved slightly ahead of us in 2003 to recover ground
we never lost.
At year-end, our equity market capitalization — our
share price times the number of outstanding common
shares — was bigger than Federal Express or General
Mills. At $20.8 billion, ranked by market capitalization,
we were the nation’s third-largest natural gas and electric
company.
Operating Cash Flow:
Significant Growth Expected in 2004
In past years, I’ve told you that cash is king.
In 2004, we expect to generate positive free cash
flow, barring any major new acquisition or unforeseen