Dominion Power 2003 Annual Report Download - page 6
Download and view the complete annual report
Please find page 6 of the 2003 Dominion Power annual report below. You can navigate through the pages in the report by either clicking on the pages listed below, or by using the keyword search tool below to find specific information within the annual report.-
 1
1 -
 2
2 -
 3
3 -
 4
4 -
 5
5 -
 6
6 -
 7
7 -
 8
8 -
 9
9 -
 10
10 -
 11
11 -
 12
12 -
 13
13 -
 14
14 -
 15
15 -
 16
16 -
 17
17 -
18
-
19
-
20
-
21
-
22
-
23
-
24
-
25
-
26
-
27
-
28
-
29
-
30
-
31
-
32
-
33
-
34
-
35
-
36
-
37
-
38
-
39
-
40
-
41
-
42
-
43
-
44
-
45
-
46
-
47
-
48
-
49
-
50
-
51
-
52
-
53
-
54
-
55
-
56
-
57
-
58
-
59
-
60
-
61
-
62
-
63
-
64
-
65
-
66
-
67
-
68
-
69
-
70
-
71
-
72
-
73
-
74
-
75
-
76
-
77
-
78
-
79
-
80
-
81
-
82
-
83
-
84
-
85
-
86
-
87
-
88
-
89
-
90
-
91
-
92
-
93
-
94
-
95
-
96
-
97
-
98
-
99
-
100
-
101
-
102
-
103
-
104
 |
 |

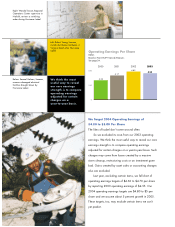
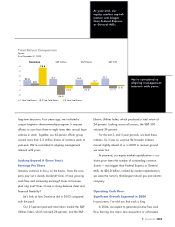
We Target 2004 Operating Earnings of
$4.80 to $5.00 Per Share
The likes of Isabel don’t come around often.
So we excluded its costs from our 2003 operating
earnings. We think the most useful way to reveal our core
earnings strength is to compare operating earnings
adjusted for certain charges on a year-to-year basis. Such
charges may come from losses created by a massive
storm cleanup, restructuring costs or an investment gone
bad. Gains created by asset sales or accounting changes
also are excluded.
Last year, excluding certain items, we fell short of
operating earnings targets of $4.60 to $4.70 per share
by reporting 2003 operating earnings of $4.55. Our
2004 operating earnings targets are $4.80 to $5 per
share and we assume about 5 percent growth in 2005.
These targets, too, may exclude certain items we can’t
yet predict.
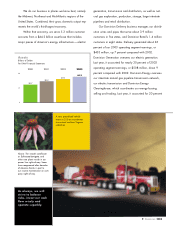
Left: Robert Young, lineman,
installs distribution hardware in
Virginia Beach after Hurricane
Isabel.
Right: Wanda Trescot, Regional
Operations Center supervisor in
Norfolk, reviews a switching
order during Hurricane Isabel.
Below: Samuel Holmes, lineman,
removes damaged electrical
facilities brought down by
Hurricane Isabel.
We think the most
useful way to reveal
our core earnings
strength is to compare
operating earnings
adjusted for certain
charges on a
year-to-year basis.
5.00
2.50
0
4.55
4.17
4.83
Operating Earnings Per Share
Dollars
Based on Non-GAAP Financial Measures
See page 24.
20032001
3.33
2000 2002