Dominion Power 2003 Annual Report Download - page 11
Download and view the complete annual report
Please find page 11 of the 2003 Dominion Power annual report below. You can navigate through the pages in the report by either clicking on the pages listed below, or by using the keyword search tool below to find specific information within the annual report.-
 1
1 -
 2
2 -
 3
3 -
 4
4 -
 5
5 -
 6
6 -
 7
7 -
 8
8 -
 9
9 -
 10
10 -
 11
11 -
 12
12 -
 13
13 -
 14
14 -
 15
15 -
 16
16 -
 17
17 -
 18
18 -
 19
19 -
 20
20 -
 21
21 -
 22
22 -
23
-
24
-
25
-
26
-
27
-
28
-
29
-
30
-
31
-
32
-
33
-
34
-
35
-
36
-
37
-
38
-
39
-
40
-
41
-
42
-
43
-
44
-
45
-
46
-
47
-
48
-
49
-
50
-
51
-
52
-
53
-
54
-
55
-
56
-
57
-
58
-
59
-
60
-
61
-
62
-
63
-
64
-
65
-
66
-
67
-
68
-
69
-
70
-
71
-
72
-
73
-
74
-
75
-
76
-
77
-
78
-
79
-
80
-
81
-
82
-
83
-
84
-
85
-
86
-
87
-
88
-
89
-
90
-
91
-
92
-
93
-
94
-
95
-
96
-
97
-
98
-
99
-
100
-
101
-
102
-
103
-
104
 |
 |

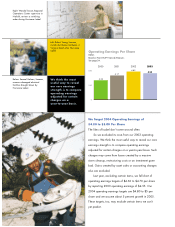
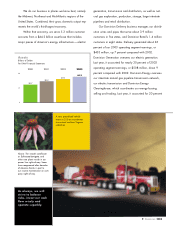
A very specialized vehicle
moves a 213-ton transformer
to a critical northern Virginia
substation.
Above: The smooth coneflower
or Echinacea laevigata, and
other rare plants reside in our
power line rights-of-way. Some
have reappeared after decades
of absence thanks in part to
our routine maintenance on com-
pany rights-of-way.
As always, we will
strive to balance
risks, invest our cash
flow wisely and
operate superbly.
50
25
0
44.2
36.4
40.0
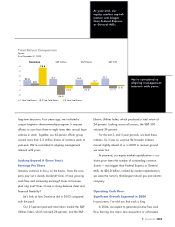
Assets
Billions of Dollars
Per GAAP Financial Statements
20032001
30.7
2000 2002
9.Dominion 2003
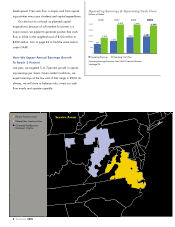
We do our business in places we know best, namely
the Midwest, Northeast and Mid-Atlantic regions of the
United States. Combined, their gross domestic output rep-
resents the world’s third-largest economy.
Within that economy, we serve 5.3 million customer
accounts from a $44.2 billion asset base that includes
major pieces of America’s energy infrastructure — electric
generation, transmission and distribution, as well as nat-
ural gas exploration, production, storage, large interstate
pipelines and retail distribution.
Our Dominion Delivery business manages our distrib-
ution wires and pipes that serve about 3.9 million
customers in five states, and Dominion Retail’s 1.4 million
customers in eight states. Delivery generated about 26
percent of our 2003 operating segment earnings, or
$453 million, up 7 percent compared with 2002.
Dominion Generation oversees our electric generation.
Last year, it accounted for nearly 30 percent of 2003
operating segment earnings, or $508 million, down 9
percent compared with 2002. Dominion Energy oversees
our interstate natural gas pipeline transmission network,
our electric transmission and Dominion Energy
Clearinghouse, which coordinates our energy buying,
selling and trading. Last year, it accounted for 20 percent