Dominion Power 2003 Annual Report Download - page 12
Download and view the complete annual report
Please find page 12 of the 2003 Dominion Power annual report below. You can navigate through the pages in the report by either clicking on the pages listed below, or by using the keyword search tool below to find specific information within the annual report.-
 1
1 -
 2
2 -
 3
3 -
 4
4 -
 5
5 -
 6
6 -
 7
7 -
 8
8 -
 9
9 -
 10
10 -
 11
11 -
 12
12 -
 13
13 -
 14
14 -
 15
15 -
 16
16 -
 17
17 -
 18
18 -
 19
19 -
 20
20 -
 21
21 -
 22
22 -
23
-
24
-
25
-
26
-
27
-
28
-
29
-
30
-
31
-
32
-
33
-
34
-
35
-
36
-
37
-
38
-
39
-
40
-
41
-
42
-
43
-
44
-
45
-
46
-
47
-
48
-
49
-
50
-
51
-
52
-
53
-
54
-
55
-
56
-
57
-
58
-
59
-
60
-
61
-
62
-
63
-
64
-
65
-
66
-
67
-
68
-
69
-
70
-
71
-
72
-
73
-
74
-
75
-
76
-
77
-
78
-
79
-
80
-
81
-
82
-
83
-
84
-
85
-
86
-
87
-
88
-
89
-
90
-
91
-
92
-
93
-
94
-
95
-
96
-
97
-
98
-
99
-
100
-
101
-
102
-
103
-
104
 |
 |

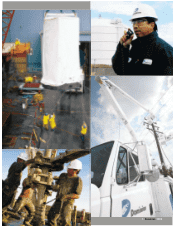
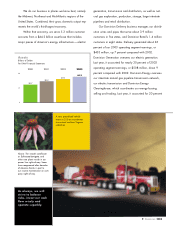
Left: Dominion’s operations in
the Black Warrior Basin in
northwest Alabama make us one
of the nation’s largest coal-bed
methane-gas producers.
Dominion produces more than
100 million cubic feet per day
from all of our coal-bed methane
properties.
10.Dominion 2003
Our E&P people like
to think they run a
“gas factory.”
Right: Dominion’s West
Cameron 100 in the Gulf of
Mexico is one of the largest
recent shelf discoveries at well
depths shallower than 15,000
feet. Dominion’s share of
production from the platform is
in excess of 75 million cubic feet
of gas equivalent per day.
We’re producing
about 450 billion
cubic feet equivalent
annually, roughly
three-quarters
of it from onshore
reserves.
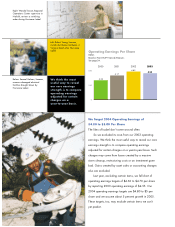
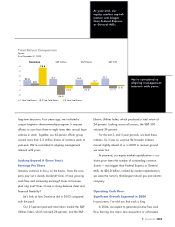
7.0
3.5
0
6.4
4.9
6.1
Proved Gas and Oil Reserves*
Trillion Cubic Feet Equivalent (Tcfe)
20032001
2.8
2000 2002
* Includes reserves owned by the Exploration & Production segment
and Dominion Transmission, Inc.
of our operating segment earnings, or $350 million, up
30 percent compared with 2002, which includes a
record contribution of $64 million from the Clearinghouse.
The remaining 24 percent of 2003 operating segment
earnings, or $415 million, came from our Dominion
Exploration & Production segment, up 9 percent com-
pared with a year earlier. Net expenses from our corpo-
rate operations, excluding certain items listed on page
24, amounted to $277 million in 2003, up about 4 per-
cent compared with a year earlier.
Page 24 also shows a comparison of these operating
segment earnings to our reported earnings under GAAP.
Reliable Production At Our “Gas Factory”
Our E&P people like to think they run a “gas factory.”
We’re producing about 450 billion cubic feet equiva-
lent annually, roughly three-quarters of it from onshore
reserves. Much of that is embedded in coal-bed methane
and tight-gas reservoirs. Our drilling success rate in these