Dominion Power 2003 Annual Report Download - page 13
Download and view the complete annual report
Please find page 13 of the 2003 Dominion Power annual report below. You can navigate through the pages in the report by either clicking on the pages listed below, or by using the keyword search tool below to find specific information within the annual report.-
 1
1 -
2
-
 3
3 -
 4
4 -
 5
5 -
 6
6 -
 7
7 -
 8
8 -
 9
9 -
 10
10 -
 11
11 -
 12
12 -
 13
13 -
 14
14 -
 15
15 -
 16
16 -
 17
17 -
 18
18 -
 19
19 -
 20
20 -
 21
21 -
 22
22 -
 23
23 -
24
-
25
-
26
-
27
-
28
-
29
-
30
-
31
-
32
-
33
-
34
-
35
-
36
-
37
-
38
-
39
-
40
-
41
-
42
-
43
-
44
-
45
-
46
-
47
-
48
-
49
-
50
-
51
-
52
-
53
-
54
-
55
-
56
-
57
-
58
-
59
-
60
-
61
-
62
-
63
-
64
-
65
-
66
-
67
-
68
-
69
-
70
-
71
-
72
-
73
-
74
-
75
-
76
-
77
-
78
-
79
-
80
-
81
-
82
-
83
-
84
-
85
-
86
-
87
-
88
-
89
-
90
-
91
-
92
-
93
-
94
-
95
-
96
-
97
-
98
-
99
-
100
-
101
-
102
-
103
-
104
 |
 |

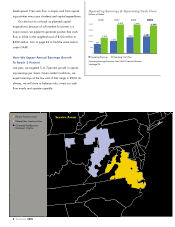
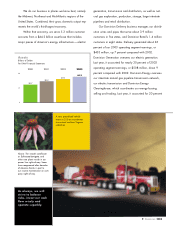
Dominion Exploration & Production (Major Operating Areas)
Proved Reserves (Bcfe)
As of December 31, 2003:
6,388
Daily Production (Mmcfe/day)
Year-to-date December 31, 2003:
1,228
= 100 Bcfe
Includes Dominion Transmission, Inc.
1Canada
Proved Reserves (Bcfe): 772
Daily Production (Mmcfe/day): 153
2 Gulf Coast
Proved Reserves (Bcfe): 715
Daily Production (Mmcfe/day): 193
3 Gulf of Mexico
Proved Reserves (Bcfe): 1,130
Daily Production (Mmcfe/day): 318
4 Appalachian/
Michigan Basin
Proved Reserves (Bcfe): 1,195
Daily Production (Mmcfe/day): 152
5 Mid-Continent
Proved Reserves (Bcfe): 644
Daily Production (Mmcfe/day): 119
6 Permian
Proved Reserves (Bcfe): 1,417
Daily Production (Mmcfe/day): 178
7 Rocky Mountain / Other
Proved Reserves (Bcfe): 515
Daily Production (Mmcfe/day): 115
1
7
6
5
3
4
2
2
4
2
11.Dominion 2003
gas factories is more than 95 percent. We don’t have a
lot of risk, but we have to get these low-risk, long-lived
reserves out of the ground efficiently. They are the back-
bone of our E&P assets. Overall, more than 80 percent of
Dominion E&P’s 6.4 trillion cubic feet of proved natural
gas and oil reserve base resides onshore, principally in
the Appalachian Basin, west Texas and western Canada.
Offshore properties in the Gulf of Mexico have
been yielding about 25 percent of E&P’s production.
There, we typically share costs with partners to minimize
the higher risks of finding these potentially rewarding off-
shore reserves and producing gas and oil from them. This
opens up an upside component to our overall program.
In short, this blend —weighted towards low-risk,
onshore reserves— provides stable and relatively pre-
dictable earnings and cash flow. Dominion was one of
the most active onshore operators in both 2002 and
2003. On a net basis, we drilled 922 wells in 2003 and
expect even more in 2004.
Retail Rate Certainty Also
an Investor Advantage
In the past, the electric utility business was a lot simpler.
We built power plants approved by regulators and
sold all the output into our franchise service territories at
rates, including profit levels, which regulators deter-
mined. Much of this has changed in efforts to deregulate
the power industry. Dominion Virginia Power now oper-
ates under capped rates. From an investor perspective,
it’s a competitive advantage because savings from produc-
tivity gains go to the bottom line. Rate stability also benefits
Dominion Virginia Power’s retail customers.
In our electric-utility service area we have rate
certainty in Virginia until 2007. As we went to press,
Virginia legislators were studying the possibility of a
rate-cap extension. At our natural gas-utility service areas
in Ohio, West Virginia and Pennsylvania, which serve
about 1.7 million retail customers, we still operate under
stable forms of traditional regulation.