Dish Network 2002 Annual Report Download - page 67
Download and view the complete annual report
Please find page 67 of the 2002 Dish Network annual report below. You can navigate through the pages in the report by either clicking on the pages listed below, or by using the keyword search tool below to find specific information within the annual report.-
 1
1 -
2
-
3
-
4
-
5
-
6
-
7
-
8
-
9
-
10
-
11
-
12
-
13
-
14
-
15
-
16
-
17
-
18
-
19
-
20
-
21
-
22
-
23
-
24
-
25
-
26
-
27
-
28
-
29
-
30
-
31
-
32
-
33
-
34
-
35
-
36
-
37
-
38
-
39
-
40
-
41
-
42
-
43
-
44
-
45
-
46
-
47
-
48
-
49
-
50
-
51
-
52
-
53
-
54
-
55
-
56
-
 57
57 -
 58
58 -
 59
59 -
 60
60 -
 61
61 -
 62
62 -
 63
63 -
 64
64 -
 65
65 -
 66
66 -
 67
67 -
 68
68 -
 69
69 -
 70
70 -
 71
71 -
 72
72 -
 73
73 -
 74
74 -
 75
75 -
 76
76 -
 77
77 -
78
-
79
-
80
-
81
-
82
-
83
-
84
-
85
-
86
-
87
-
88
-
89
-
90
-
91
-
92
-
93
-
94
-
95
-
96
-
97
-
98
-
99
-
100
-
101
-
102
-
103
 |
 |

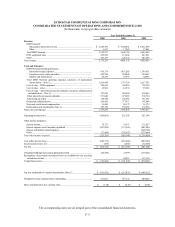
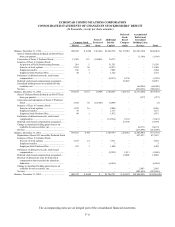
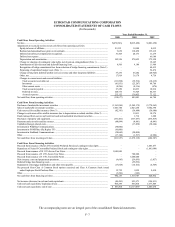
ECHOSTAR COMMUNICATIONS CORPORATION
CONSOLIDATED STATEMENTS OF CASH FLOWS
(In thousands)
The accompanying notes are an integral part of the consolidated financial statements.
F–7
Year Ended December 31,
2000 2001 2002
Cash Flows From Operating Activities:
Net loss........................................................................................................................................................ $(650,326) $(215,498) $ (881,650)
Adjustments to reconcile net loss to net cash flows from operating activities:
Equity in losses of affiliates ................................................................................................................... 29,115 34,908 8,012
Realized and unrealized loss (gain) on investments .............................................................................. 3,039 110,458 135,619
Deferred stock-based compensation recognized.................................................................................... 51,465 20,173 11,279
Deferred tax expense.............................................................................................................................. – – 66,149
Depreciation and amortization............................................................................................................... 185,356 278,652 372,958
Change in valuation of contingent value rights, net of gain on extinguishment (Note 1) .................... – – 19,645
Amortization of debt discount and deferred financing costs................................................................. 6,506 9,189 11,906
Recognition of bridge commitment fees from reduction of bridge financing commitments (Note 1). – – 48,435
Expensing of capitalized merger costs (Note 1) .................................................................................... – – 56,474
Change in long-term deferred satellite services revenue and other long-term liabilities ...................... 37,236 46,282 (20,924)
Other, net................................................................................................................................................ 17,819 36,179 4,756
Changes in current assets and current liabilities:
Trade accounts receivable, net .......................................................................................................... (111,898) (39,514) (10,619)
Inventories ......................................................................................................................................... (41,851) (25,247) 69,709
Other current assets ........................................................................................................................... (8,296) (8,316) (474)
Trade accounts payable ..................................................................................................................... 27,250 28,233 18,014
Deferred revenue................................................................................................................................ 100,776 75,529 84,333
Accrued expenses .............................................................................................................................. 235,132 138,455 73,122
Net cash flows from operating activities .................................................................................................... (118,677) 489,483 66,744
Cash Flows From Investing Activities:
Purchases of marketable investment securities .......................................................................................... (1,363,884) (2,549,179) (5,770,963)
Sales of marketable investment securities .................................................................................................. 1,041,784 2,023,268 5,602,398
Cash reserved for satellite insurance (Note 3)............................................................................................ (82,393) (59,488) (59,680)
Change in cash reserved for satellite insurance due to depreciation on related satellites (Note 3) ........... – 19,813 30,376
Funds released from escrow and restricted cash and marketable investment securities............................ – 1,712 1,288
Purchases of property and equipment......................................................................................................... (331,401) (637,457) (435,819)
Payments under in-orbit satellite contract .................................................................................................. (48,894) (8,441) (8,441)
Capitalized merger-related costs................................................................................................................. – (17,830) (38,644)
Investment in Wildblue Communications.................................................................................................. (50,000) – –
Investment in SONICblue (fka Replay TV) ............................................................................................... (10,000) – –
Investment in StarBand Communications.................................................................................................. (50,045) (50,000) –
Other............................................................................................................................................................ (17,124) (1,517) (2,902)
Net cash flows from investing activities..................................................................................................... (911,957) (1,279,119) (682,387)
Cash Flows From Financing Activities:
Proceeds from issuance of Series D Convertible Preferred Stock and contingent value rights................. – – 1,483,477
Repurchase of Series D Convertible Preferred Stock and contingent value rights.................................... – – (1,065,689)
Proceeds from issuance of 10 3/8% Seven Year Notes.............................................................................. 1,000,000 – –
Proceeds from issuance of 9 1/8% Seven Year Notes................................................................................ – 700,000 –
Proceeds from issuance of 5 3/4% Convertible Notes ............................................................................... – 1,000,000 –
Debt issuance costs and prepayment premiums......................................................................................... (9,645) (29,450) (1,837)
Deferred bridge loan financing costs.......................................................................................................... – (55,250) –
Repayments of mortgage indebtedness and other notes payable............................................................... (17,668) (14,182) (4,549)
Net proceeds from Class A Common Stock options exercised and Class A Common Stock issued
under Employee Stock Purchase Plan.................................................................................................... 12,732 9,929 9,430
Other............................................................................................................................................................ (3,266) (340) –
Net cash flows from financing activities .................................................................................................... 982,153 1,610,707 420,832
Net increase (decrease) in cash and cash equivalents ................................................................................ (48,481) 821,071 (194,811)
Cash and cash equivalents, beginning of year............................................................................................ 905,299 856,818 1,677,889
Cash and cash equivalents, end of year...................................................................................................... $ 856,818 $1,677,889 1,483,078