Dish Network 2002 Annual Report Download - page 30
Download and view the complete annual report
Please find page 30 of the 2002 Dish Network annual report below. You can navigate through the pages in the report by either clicking on the pages listed below, or by using the keyword search tool below to find specific information within the annual report.-
 1
1 -
2
-
3
-
4
-
5
-
6
-
7
-
8
-
9
-
10
-
11
-
12
-
13
-
14
-
15
-
16
-
17
-
18
-
19
-
 20
20 -
 21
21 -
 22
22 -
 23
23 -
 24
24 -
 25
25 -
 26
26 -
 27
27 -
 28
28 -
 29
29 -
 30
30 -
 31
31 -
 32
32 -
 33
33 -
 34
34 -
 35
35 -
 36
36 -
 37
37 -
 38
38 -
 39
39 -
 40
40 -
41
-
42
-
43
-
44
-
45
-
46
-
47
-
48
-
49
-
50
-
51
-
52
-
53
-
54
-
55
-
56
-
57
-
58
-
59
-
60
-
61
-
62
-
63
-
64
-
65
-
66
-
67
-
68
-
69
-
70
-
71
-
72
-
73
-
74
-
75
-
76
-
77
-
78
-
79
-
80
-
81
-
82
-
83
-
84
-
85
-
86
-
87
-
88
-
89
-
90
-
91
-
92
-
93
-
94
-
95
-
96
-
97
-
98
-
99
-
100
-
101
-
102
-
103
 |
 |

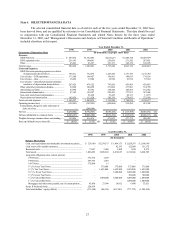
28
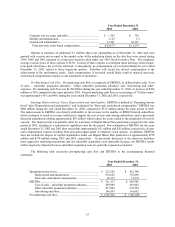
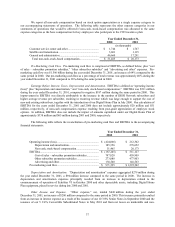
Year Ended December 31,
1998 1999 2000 2001 2002
(In thousands, except subscribers and per subscriber data)
Other Data
DISH Network subscribers ....................................... 1,940,000 3,410,000 5,260,000 6,830,000 8,180,000
Average monthly revenue per subscriber.................. $ 39.25 $ 42.71 $ 45.33 $ 49.32 $ 49.17
EBITDA(4)................................................................ (20,255) (172,803) (187,245) 511,127 805,585
Less amortization of subscriber acquisition costs..... (18,869) – – – –
EBITDA, as adjusted to exclude amortization of
subscriber acquisition costs .................................. (39,124) (172,803) (187,245) 511,127 805,585
Net cash flows from:
Operating activities............................................... (16,890) (58,513) (118,677) 489,483 66,744
Investing activities ................................................ (8,048) (62,826) (911,957) (1,279,119) (682,387)
Financing activities............................................... (13,722) 920,091 982,153 1,610,707 420,832
(1) Net loss in 2002 includes $690 million related to merger termination costs.
(2) The net loss attributable to common shares in 2002 of $444 million differs significantly from net loss in 2002 of $882 million due to a gain on
repurchase of Series D Convertible Preferred Stock of approximately $437 million.
(3) The loss per share amount in 1999 of $(1.92) includes $(1.28) per share relating to basic and diluted loss per share before extraordinary charges
and $(0.64) per share relating to the extraordinary charge for early retirement of debt, net of tax.
(4) We believe it is common practice in the telecommunications industry for investment bankers and other investors to use various multiples of
current or projected EBITDA (operating income (loss) plus depreciation and amortization, and non-cash, stock-based compensation) for purposes
of estimating current or prospective enterprise value and as one of many measures of operating performance. Conceptually, EBITDA measures
the amount of income generated each period that could be used to service debt, pay taxes and fund capital expenditures because EBITDA is
independent of the actual leverage employed by the business. We use EBITDA, as defined above, as one of the key measurements of operating
efficiency and overall financial performance and believe EBITDA can be a helpful measure for those evaluating companies in the multi-channel
video programming distribution market. Some investment analysts track the relationship of EBITDA to total debt as one measure of financial
strength. However, EBITDA does not purport to represent cash provided or used by operating activities and should not be considered in isolation
or as a substitute for measures of performance prepared in accordance with generally accepted accounting principles.
EBITDA differs significantly from cash flows from operating activities reflected in the consolidated statement of cash flows. Cash flows from
operating activities is net of interest and taxes paid and is a more comprehensive determination of periodic income on a cash (vs. accrual) basis,
exclusive of non-cash items of income and expenses such as depreciation and amortization. In contrast, EBITDA is derived from accrual basis
income and is not reduced for cash invested in working capital. Consequently, EBITDA is not affected by the timing of receivable collections or
when accrued expenses are paid. We are not aware of any uniform standards for determining EBITDA and believe presentations of EBITDA
may not be calculated consistently by different entities in the same or similar businesses. We have shown EBITDA with the add-back of the
amortization of subscriber acquisition costs, which were deferred through September 1997 and amortized over one year. EBITDA for the years
ended December 31, 1999, 2000, 2001 and 2002 also excludes approximately $61 million, $51 million, $20 million and $11 million, respectively,
in non-cash, stock-based compensation expense resulting from significant post-grant appreciation of stock options granted to employees. In
addition, EBITDA does not include the impact of capital expenditures under our Digital Home Plan of approximately $65 million, $338 million
and $278 million during the years ended December 31, 2000, 2001 and 2002, respectively. See Item 7 “Management’s Discussion and Analysis
of Financial Condition and Results of Operations” for the quantitative reconciliation of EBITDA to the accompanying financial statements.