Dell 2011 Annual Report Download - page 51
Download and view the complete annual report
Please find page 51 of the 2011 Dell annual report below. You can navigate through the pages in the report by either clicking on the pages listed below, or by using the keyword search tool below to find specific information within the annual report.-
 1
1 -
2
-
3
-
4
-
5
-
6
-
7
-
8
-
9
-
10
-
11
-
12
-
13
-
14
-
15
-
16
-
17
-
18
-
19
-
20
-
21
-
22
-
23
-
24
-
25
-
26
-
27
-
28
-
29
-
30
-
31
-
32
-
33
-
34
-
35
-
36
-
37
-
38
-
39
-
40
-
 41
41 -
 42
42 -
 43
43 -
 44
44 -
 45
45 -
 46
46 -
 47
47 -
 48
48 -
 49
49 -
 50
50 -
 51
51 -
 52
52 -
 53
53 -
 54
54 -
 55
55 -
 56
56 -
 57
57 -
 58
58 -
 59
59 -
 60
60 -
 61
61 -
62
-
63
-
64
-
65
-
66
-
67
-
68
-
69
-
70
-
71
-
72
-
73
-
74
-
75
-
76
-
77
-
78
-
79
-
80
-
81
-
82
-
83
-
84
-
85
-
86
-
87
-
88
-
89
-
90
-
91
-
92
-
93
-
94
-
95
-
96
-
97
-
98
-
99
-
100
-
101
-
102
-
103
-
104
-
105
-
106
-
107
-
108
-
109
-
110
-
111
-
112
-
113
-
114
-
115
-
116
-
117
-
118
-
119
-
120
-
121
-
122
-
123
-
124
-
125
-
126
-
127
-
128
-
129
-
130
-
131
-
132
-
133
-
134
-
135
-
136
-
137
 |
 |

Table of Contents
financing activities of $0.5 billion and $2.0 billion for Fiscal 2011 and Fiscal 2010, respectively. The slight year-over-year increase in cash provided by
financing activities for Fiscal 2012 was primarily due to the issuance of $1.5 billion in commercial paper, compared to a net repayment of $0.5 billion of
commercial paper in Fiscal 2011. The increase was offset by an additional $1.9 billion in share repurchases during Fiscal 2012 over the prior year.
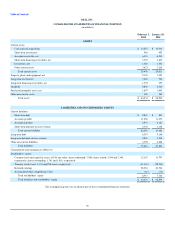
As of February 3, 2012, we had $9.3 billion of total debt, compared to $6.0 billion and $4.1 billion of total debt as of January 28, 2011, and January 29, 2010,
respectively. Of this amount, we had $6.3 billion principal amount of our senior notes outstanding as of February 3, 2012, compared to $4.8 billion and $3.3
billion principal amount of senior notes outstanding as of January 28, 2011, and January 29, 2010, respectively.
We have $3.0 billion of senior unsecured revolving credit facilities primarily to support our $2.5 billion commercial paper program. Of the credit facilities,
$1.0 billion will expire on April 2, 2013, and $2.0 billion will expire on April 15, 2015. No amounts were outstanding under our revolving credit facilities as
of February 3, 2012, January 28, 2011, or January 29, 2010. We had $1.5 billion of commercial paper outstanding as of February 3, 2012. As of January 28,
2011, we did not have any amounts outstanding under the commercial paper program compared to $0.5 billion of commercial paper outstanding as of January
29, 2010. See Note 5 of the Notes to Consolidated Financial Statements under “Part II — Item 8 — Financial Statements and Supplementary Data” for further
discussion of our debt.
We issued structured financing-related debt to fund our financing receivables as discussed under “Financing Receivables” above. The total debt capacity of
our securitization programs is $1.4 billion. We had $1.3 billion in outstanding structured financing securitization debt as of February 3, 2012. Our
securitization programs are structured to operate near their debt capacity. We balance the use of our securitization programs with working capital and other
sources of liquidity to fund growth in our financing receivables. In November 2011, we changed counterparties for our existing revolving loan securitization
program to a counterparty offering more favorable terms. We expect to renew one of our fixed-term securitization programs as part of our annual renewal
process in the first quarter of Fiscal 2013. See Note 4 of the Notes to Consolidated Financial Statements under “Part II — Item 8 — Financial Statements and
Supplementary Data” for further discussion of our structured financing debt.
We also repurchased approximately 178 million shares of common stock for $2.7 billion during Fiscal 2012 compared to approximately 57 million shares of
common stock for $800 million during Fiscal 2011. During the third quarter of Fiscal 2012, our Board of Directors authorized an additional $5 billion for our
share repurchase program. As of February 3, 2012, $6.0 billion remained available for future share repurchases.
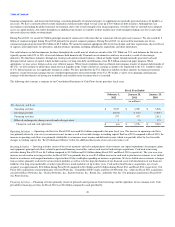
Key Performance Metrics — Our cash conversion cycle for the fiscal quarter ended February 3, 2012, improved from the fiscal quarter ended January 28,
2011, and was essentially unchanged from the fiscal quarter ended January 29, 2010. Our business model allows us to maintain an efficient cash conversion
cycle, which compares favorably with that of others in our industry.
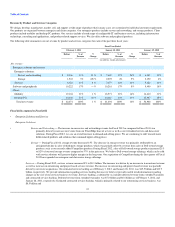
The following table presents the components of our cash conversion cycle for the fourth quarter of each of the past three fiscal years:
Fiscal Quarter Ended
February 3,
2012 January 28,
2011 January 29,
2010
Days of sales outstanding(a) 42 40 38
Days of supply in inventory(b) 11 9 8
Days in accounts payable(c) (89) (82) (82)
Cash conversion cycle (36) (33) (36)
_____________________
(a) Days of sales outstanding (“DSO”) calculates the average collection period of our receivables. DSO is based on the ending net trade receivables and the most recent quarterly revenue for
each period. DSO also includes the effect of product costs related to customer shipments not yet recognized as revenue that are classified in other current assets. DSO is calculated
by adding accounts receivable, net of allowance for doubtful accounts, and customer shipments in transit and dividing that sum by average net revenue per day for the current
quarter (97 days for Fiscal 2012; 90 days for Fiscal 2011 and Fiscal 2010). At February 3, 2012, January 28, 2011 and January 29, 2010, DSO and days of customer shipments not
yet recognized were 39 and 3 days, 37 and 3 days, and 35 and 3 days, respectively.
(b) Days of supply in inventory (“DSI”) measures the average number of days from procurement to sale of our product. DSI is based on ending inventory and most recent quarterly cost of
sales for each period. DSI is calculated by dividing inventory by average cost of goods sold per day for the current quarter (97 days for Fiscal 2012; 90 days for Fiscal 2011 and Fiscal
2010).
(c) Days in accounts payable (“DPO”) calculates the average number of days our payables remain outstanding before payment. DPO is based on ending accounts payable and most recent
quarterly cost of sales for each period. DPO is calculated by dividing accounts payable by average cost of goods sold per day for the current quarter (97 days for Fiscal 2012; 90 days for
Fiscal 2011 and Fiscal 2010).
Our cash conversion cycle increased three days at February 3, 2012, from January 28, 2011, driven by a seven day increase in
49