Dell 2011 Annual Report Download - page 38
Download and view the complete annual report
Please find page 38 of the 2011 Dell annual report below. You can navigate through the pages in the report by either clicking on the pages listed below, or by using the keyword search tool below to find specific information within the annual report.-
 1
1 -
2
-
3
-
4
-
5
-
6
-
7
-
8
-
9
-
10
-
11
-
12
-
13
-
14
-
15
-
16
-
17
-
18
-
19
-
20
-
21
-
22
-
23
-
24
-
25
-
26
-
27
-
 28
28 -
 29
29 -
 30
30 -
 31
31 -
 32
32 -
 33
33 -
 34
34 -
 35
35 -
 36
36 -
 37
37 -
 38
38 -
 39
39 -
 40
40 -
 41
41 -
 42
42 -
 43
43 -
 44
44 -
 45
45 -
 46
46 -
 47
47 -
 48
48 -
49
-
50
-
51
-
52
-
53
-
54
-
55
-
56
-
57
-
58
-
59
-
60
-
61
-
62
-
63
-
64
-
65
-
66
-
67
-
68
-
69
-
70
-
71
-
72
-
73
-
74
-
75
-
76
-
77
-
78
-
79
-
80
-
81
-
82
-
83
-
84
-
85
-
86
-
87
-
88
-
89
-
90
-
91
-
92
-
93
-
94
-
95
-
96
-
97
-
98
-
99
-
100
-
101
-
102
-
103
-
104
-
105
-
106
-
107
-
108
-
109
-
110
-
111
-
112
-
113
-
114
-
115
-
116
-
117
-
118
-
119
-
120
-
121
-
122
-
123
-
124
-
125
-
126
-
127
-
128
-
129
-
130
-
131
-
132
-
133
-
134
-
135
-
136
-
137
 |
 |

Table of Contents
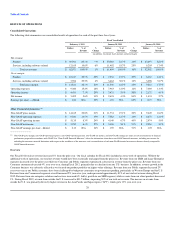
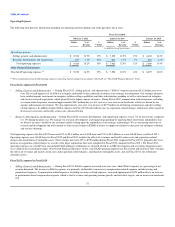
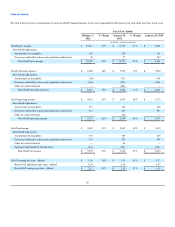
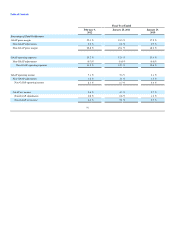
The table below presents a reconciliation of each non-GAAP financial measure to the most comparable GAAP measure for each of the past three fiscal years:
Fiscal Year Ended
February 3,
2012 % Change January 28,
2011 % Change January 29, 2010
(in millions, except percentages)
GAAP gross margin $ 13,811 21% $ 11,396 23% $ 9,261
Non-GAAP adjustments:
Amortization of intangibles 305 278 151
Severance and facility actions and acquisition-related costs 49 57 237
Non-GAAP gross margin $ 14,165 21% $ 11,731 22% $ 9,649
GAAP operating expenses $ 9,380 18% $ 7,963 12% $ 7,089
Non-GAAP adjustments:
Amortization of intangibles (86) (71) (54)
Severance and facility actions and acquisition-related costs (264) (170) (360)
Other fees and settlements — (140) —
Non-GAAP operating expenses $ 9,030 19% $ 7,582 14% $ 6,675
GAAP operating income $ 4,431 29% $ 3,433 58% $ 2,172
Non-GAAP adjustments:
Amortization of intangibles 391 349 205
Severance and facility actions and acquisition-related costs 313 227 597
Other fees and settlements — 140 —
Non-GAAP operating income $ 5,135 24% $ 4,149 40% $ 2,974
GAAP net income $ 3,492 33% $ 2,635 84% $ 1,433
Non-GAAP adjustments:
Amortization of intangibles 391 349 205
Severance and facility actions and acquisition-related costs 313 227 597
Other fees and settlements — 68 —
Aggregate adjustment for income taxes (244) (173) (181)
Non-GAAP net income $ 3,952 27% $ 3,106 51% $ 2,054
GAAP earnings per share - diluted $ 1.88 39% $ 1.35 85% $ 0.73
Non-GAAP adjustments per share - diluted 0.25 0.24 0.32
Non-GAAP earnings per share - diluted $ 2.13 34% $ 1.59 51% $ 1.05
36