Dell 2011 Annual Report Download - page 27
Download and view the complete annual report
Please find page 27 of the 2011 Dell annual report below. You can navigate through the pages in the report by either clicking on the pages listed below, or by using the keyword search tool below to find specific information within the annual report.-
 1
1 -
2
-
3
-
4
-
5
-
6
-
7
-
8
-
9
-
10
-
11
-
12
-
13
-
14
-
15
-
16
-
 17
17 -
 18
18 -
 19
19 -
 20
20 -
 21
21 -
 22
22 -
 23
23 -
 24
24 -
 25
25 -
 26
26 -
 27
27 -
 28
28 -
 29
29 -
 30
30 -
 31
31 -
 32
32 -
 33
33 -
 34
34 -
 35
35 -
 36
36 -
 37
37 -
38
-
39
-
40
-
41
-
42
-
43
-
44
-
45
-
46
-
47
-
48
-
49
-
50
-
51
-
52
-
53
-
54
-
55
-
56
-
57
-
58
-
59
-
60
-
61
-
62
-
63
-
64
-
65
-
66
-
67
-
68
-
69
-
70
-
71
-
72
-
73
-
74
-
75
-
76
-
77
-
78
-
79
-
80
-
81
-
82
-
83
-
84
-
85
-
86
-
87
-
88
-
89
-
90
-
91
-
92
-
93
-
94
-
95
-
96
-
97
-
98
-
99
-
100
-
101
-
102
-
103
-
104
-
105
-
106
-
107
-
108
-
109
-
110
-
111
-
112
-
113
-
114
-
115
-
116
-
117
-
118
-
119
-
120
-
121
-
122
-
123
-
124
-
125
-
126
-
127
-
128
-
129
-
130
-
131
-
132
-
133
-
134
-
135
-
136
-
137
 |
 |

Table of Contents
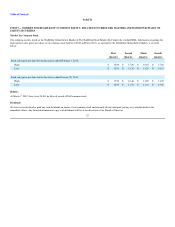
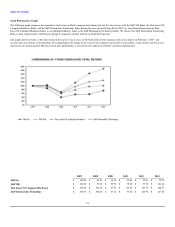
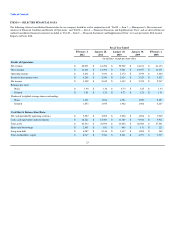
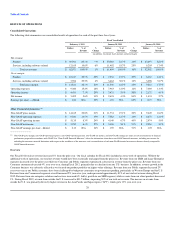
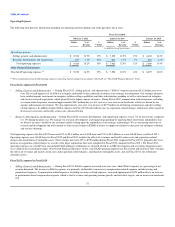
ITEM 6 — SELECTED FINANCIAL DATA
The following selected consolidated financial data for our company should be read in conjunction with “Part II — Item 7 — Management’s Discussion and
Analysis of Financial Condition and Results of Operations” and “Part II — Item 8 — Financial Statements and Supplementary Data” and are derived from our
audited consolidated financial statements included in “Part II — Item 8 — Financial Statements and Supplementary Data” or in our previously filed Annual
Reports on Form 10-K.
Fiscal Year Ended
February 3,
2012 January 28,
2011 January 29,
2010 January 30,
2009 February 1,
2008
(in millions, except per share data)
Results of Operations:
Net revenue $ 62,071 $ 61,494 $ 52,902 $ 61,101 $ 61,133
Gross margin $ 13,811 $ 11,396 $ 9,261 $ 10,957 $ 11,671
Operating income $ 4,431 $ 3,433 $ 2,172 $ 3,190 $ 3,440
Income before income taxes $ 4,240 $ 3,350 $ 2,024 $ 3,324 $ 3,827
Net income $ 3,492 $ 2,635 $ 1,433 $ 2,478 $ 2,947
Earnings per share:
Basic $ 1.90 $ 1.36 $ 0.73 $ 1.25 $ 1.33
Diluted $ 1.88 $ 1.35 $ 0.73 $ 1.25 $ 1.31
Number of weighted-average shares outstanding:
Basic 1,838 1,944 1,954 1,980 2,223
Diluted 1,853 1,955 1,962 1,986 2,247
Cash Flow & Balance Sheet Data:
Net cash provided by operating activities $ 5,527 $ 3,969 $ 3,906 $ 1,894 $ 3,949
Cash, cash equivalents and investments $ 18,222 $ 15,069 $ 11,789 $ 9,546 $ 9,532
Total assets $ 44,533 $ 38,599 $ 33,652 $ 26,500 $ 27,561
Short-term borrowings $ 2,867 $ 851 $ 663 $ 113 $ 225
Long-term debt $ 6,387 $ 5,146 $ 3,417 $ 1,898 $ 362
Total stockholders’ equity $ 8,917 $ 7,766 $ 5,641 $ 4,271 $ 3,735
25