Dell 2011 Annual Report Download - page 32
Download and view the complete annual report
Please find page 32 of the 2011 Dell annual report below. You can navigate through the pages in the report by either clicking on the pages listed below, or by using the keyword search tool below to find specific information within the annual report.-
 1
1 -
2
-
3
-
4
-
5
-
6
-
7
-
8
-
9
-
10
-
11
-
12
-
13
-
14
-
15
-
16
-
17
-
18
-
19
-
20
-
21
-
 22
22 -
 23
23 -
 24
24 -
 25
25 -
 26
26 -
 27
27 -
 28
28 -
 29
29 -
 30
30 -
 31
31 -
 32
32 -
 33
33 -
 34
34 -
 35
35 -
 36
36 -
 37
37 -
 38
38 -
 39
39 -
 40
40 -
 41
41 -
 42
42 -
43
-
44
-
45
-
46
-
47
-
48
-
49
-
50
-
51
-
52
-
53
-
54
-
55
-
56
-
57
-
58
-
59
-
60
-
61
-
62
-
63
-
64
-
65
-
66
-
67
-
68
-
69
-
70
-
71
-
72
-
73
-
74
-
75
-
76
-
77
-
78
-
79
-
80
-
81
-
82
-
83
-
84
-
85
-
86
-
87
-
88
-
89
-
90
-
91
-
92
-
93
-
94
-
95
-
96
-
97
-
98
-
99
-
100
-
101
-
102
-
103
-
104
-
105
-
106
-
107
-
108
-
109
-
110
-
111
-
112
-
113
-
114
-
115
-
116
-
117
-
118
-
119
-
120
-
121
-
122
-
123
-
124
-
125
-
126
-
127
-
128
-
129
-
130
-
131
-
132
-
133
-
134
-
135
-
136
-
137
 |
 |

Table of Contents
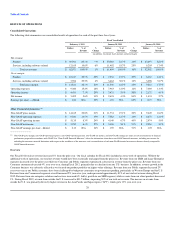
time. During Fiscal 2012, we experienced favorable changes in foreign currency exchange rates, though the impact of these currency movements was not
material to our results for the period.
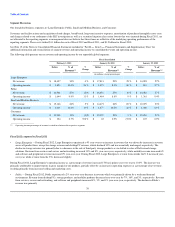
Fiscal 2011 compared to Fiscal 2010
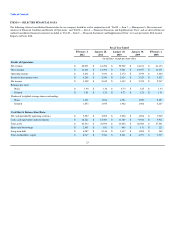
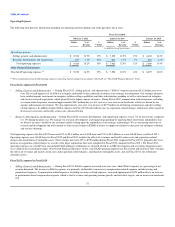
•Product Revenue — Product revenue increased year-over-year by 14% for Fiscal 2011. Our product revenue performance was primarily attributable to
improved customer demand as a result of increased global IT spending from our Commercial customers across all product categories as well as a shift in
mix to higher priced products. See "Revenue by Product and Services Categories" for further information regarding the average selling prices of our
products.
•Services Revenue, including software related — Services revenue, including software related, increased year-over-year by 25% for Fiscal 2011. Our
services revenue performance was attributable to a 36% year-over-year increase in services revenue, excluding software related, and an increase of 7% in
software related services revenue during Fiscal 2011. The increase in services revenue was primarily due to our acquisition of Perot Systems in the
fourth quarter of Fiscal 2010, which was integrated into our Public and Large Enterprise segments.
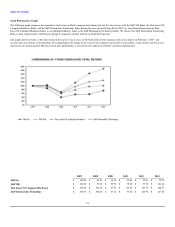
During Fiscal 2011, revenue from the U.S. increased 14% to $31.9 billion and represented 52% of total net revenue. Revenue from outside the U.S. increased
19% to $29.6 billion. Revenue from BRIC increased 38% year-over-year for Fiscal 2011. As a result of our comprehensive hedging program, our results were
not materially impacted by foreign currency exchange rates in Fiscal 2011 or Fiscal 2010.
Gross Margin
Fiscal 2012 compared to Fiscal 2011
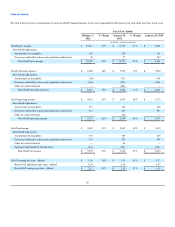
•Products — During Fiscal 2012, product gross margins increased in absolute dollars year-over-year and in gross margin percentage. Product gross
margin percentage increased to 20.5% for Fiscal 2012 from 15.9% for Fiscal 2011. A shift away from lower-value business, better supply chain
execution, a disciplined pricing strategy in a competitive environment, and favorable component cost conditions contributed to the year-over-year
increase in product gross margin percentage for all of our segments. We have created a flexible supply chain that has improved our supply chain
execution, and we have simplified our product offerings.
•Services, including software related — During Fiscal 2012, our services gross margin increased in absolute dollars compared to the prior fiscal year,
although our gross margin percentage decreased. The decrease in gross margin percentage for services, including software related, was primarily driven
by declines in gross margin percentages from our transactional and outsourcing services.
Total gross margin for Fiscal 2012 increased 21% on both a GAAP and non-GAAP basis. Total gross margin on a GAAP basis for Fiscal 2012 was $13.8
billion, compared to $14.2 billion on a non-GAAP basis. Gross margin on a GAAP basis for Fiscal 2012 and Fiscal 2011 includes the effects of amortization
of intangible assets and of severance and facility action costs and acquisition-related charges. As set forth in the reconciliation under "Non-GAAP Financial
Measures" below, these items are excluded from the calculation of non-GAAP gross margin for Fiscal 2012 and Fiscal 2011. Amortization of intangible assets
included in gross margin increased 10% to $305 million for Fiscal 2012. Severance and facility action costs and acquisition-related charges included in gross
margin decreased 14% to $49 million during Fiscal 2012. The overall decrease in severance and facility action costs and acquisition-related charges was
primarily due to a decrease in charges related to facility closures in Fiscal 2011, which was slightly offset by an increase in acquisition-related charges during
Fiscal 2012.
Fiscal 2011 compared to Fiscal 2010
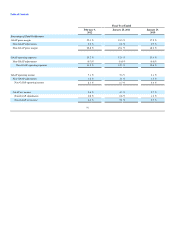
•Products — During Fiscal 2011, product gross margins increased in absolute dollars year-over-year and in gross margin percentage. Product gross
margin percentage increased to 15.9% for Fiscal 2011 from 14.1% for Fiscal 2010. Reduced component costs, improved pricing discipline, better sales
and supply chain execution, and improved quality resulting in favorable warranty experience contributed to the year-over-year increase in product gross
margin percentage.
•Services, including software related — During Fiscal 2011, our services gross margin increased in absolute dollars compared to the prior fiscal year,
although our gross margin percentage decreased. The decrease in gross margin percentage for services, including software related, was primarily due to a
higher mix of outsourcing and project-related services.
Total gross margin for Fiscal 2011 increased 23% to $11.4 billion on a GAAP basis and 22% to $11.7 billion on a non-GAAP basis from Fiscal 2010. Gross
margin on a GAAP basis for Fiscal 2011 and Fiscal 2010 includes the effects of amortization of intangible assets and of severance and facility action costs
and acquisition-related charges. As set forth in the reconciliation
30