Dell 2011 Annual Report Download - page 39
Download and view the complete annual report
Please find page 39 of the 2011 Dell annual report below. You can navigate through the pages in the report by either clicking on the pages listed below, or by using the keyword search tool below to find specific information within the annual report.-
 1
1 -
2
-
3
-
4
-
5
-
6
-
7
-
8
-
9
-
10
-
11
-
12
-
13
-
14
-
15
-
16
-
17
-
18
-
19
-
20
-
21
-
22
-
23
-
24
-
25
-
26
-
27
-
28
-
 29
29 -
 30
30 -
 31
31 -
 32
32 -
 33
33 -
 34
34 -
 35
35 -
 36
36 -
 37
37 -
 38
38 -
 39
39 -
 40
40 -
 41
41 -
 42
42 -
 43
43 -
 44
44 -
 45
45 -
 46
46 -
 47
47 -
 48
48 -
 49
49 -
50
-
51
-
52
-
53
-
54
-
55
-
56
-
57
-
58
-
59
-
60
-
61
-
62
-
63
-
64
-
65
-
66
-
67
-
68
-
69
-
70
-
71
-
72
-
73
-
74
-
75
-
76
-
77
-
78
-
79
-
80
-
81
-
82
-
83
-
84
-
85
-
86
-
87
-
88
-
89
-
90
-
91
-
92
-
93
-
94
-
95
-
96
-
97
-
98
-
99
-
100
-
101
-
102
-
103
-
104
-
105
-
106
-
107
-
108
-
109
-
110
-
111
-
112
-
113
-
114
-
115
-
116
-
117
-
118
-
119
-
120
-
121
-
122
-
123
-
124
-
125
-
126
-
127
-
128
-
129
-
130
-
131
-
132
-
133
-
134
-
135
-
136
-
137
 |
 |

Table of Contents
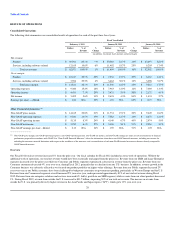
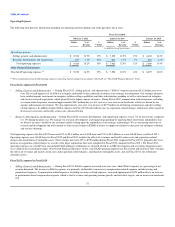
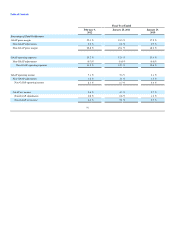
Fiscal Year Ended
February 3,
2012 January 28, 2011 January 29,
2010
Percentage of Total Net Revenue
GAAP gross margin 22.3 % 18.5 % 17.5 %
Non-GAAP adjustments 0.5 % 0.6 % 0.7 %
Non-GAAP gross margin 22.8 % 19.1 % 18.2 %
GAAP operating expenses 15.2 % 12.9 % 13.4 %
Non-GAAP adjustments (0.7)% (0.6)% (0.8)%
Non-GAAP operating expenses 14.5 % 12.3 % 12.6 %
GAAP operating income 7.1 % 5.6 % 4.1 %
Non-GAAP adjustments 1.2 % 1.1 % 1.5 %
Non-GAAP operating income 8.3 % 6.7 % 5.6 %
GAAP net income 5.6 % 4.3 % 2.7 %
Non-GAAP adjustments 0.8 % 0.8 % 1.2 %
Non-GAAP net income 6.4 % 5.1 % 3.9 %
37