Dell 2011 Annual Report Download - page 31
Download and view the complete annual report
Please find page 31 of the 2011 Dell annual report below. You can navigate through the pages in the report by either clicking on the pages listed below, or by using the keyword search tool below to find specific information within the annual report.-
 1
1 -
2
-
3
-
4
-
5
-
6
-
7
-
8
-
9
-
10
-
11
-
12
-
13
-
14
-
15
-
16
-
17
-
18
-
19
-
20
-
 21
21 -
 22
22 -
 23
23 -
 24
24 -
 25
25 -
 26
26 -
 27
27 -
 28
28 -
 29
29 -
 30
30 -
 31
31 -
 32
32 -
 33
33 -
 34
34 -
 35
35 -
 36
36 -
 37
37 -
 38
38 -
 39
39 -
 40
40 -
 41
41 -
42
-
43
-
44
-
45
-
46
-
47
-
48
-
49
-
50
-
51
-
52
-
53
-
54
-
55
-
56
-
57
-
58
-
59
-
60
-
61
-
62
-
63
-
64
-
65
-
66
-
67
-
68
-
69
-
70
-
71
-
72
-
73
-
74
-
75
-
76
-
77
-
78
-
79
-
80
-
81
-
82
-
83
-
84
-
85
-
86
-
87
-
88
-
89
-
90
-
91
-
92
-
93
-
94
-
95
-
96
-
97
-
98
-
99
-
100
-
101
-
102
-
103
-
104
-
105
-
106
-
107
-
108
-
109
-
110
-
111
-
112
-
113
-
114
-
115
-
116
-
117
-
118
-
119
-
120
-
121
-
122
-
123
-
124
-
125
-
126
-
127
-
128
-
129
-
130
-
131
-
132
-
133
-
134
-
135
-
136
-
137
 |
 |

Table of Contents
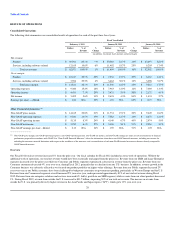
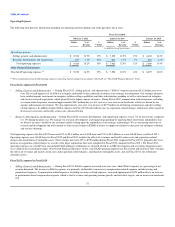
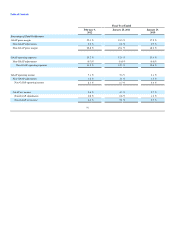
During Fiscal 2012, our consolidated operating income as a percentage of net revenue increased 150 basis points to 7.1%. The increase in operating income
percentage was primarily driven by improved product gross margins, the effect of which was partially offset by higher selling, general, and administrative
expenses, and to a lesser extent, an increase in research, development, and engineering expenditures. Operating income as a percentage of net revenue from
our Commercial segments increased 130 basis points to 10.3% year-over-year during Fiscal 2012, while our Consumer operating income percentage increased
220 basis points to 2.7%.
Our improved profitability for Fiscal 2012 was in part due to growth in our enterprise solutions and services business. For Fiscal 2012, enterprise solutions
and services revenue grew 6% year-over-year to $18.6 billion, while gross margins generated from this category grew 10% year-over-year. We also
substantially improved the profitability of our client product business in Fiscal 2012 by simplifying our product offerings, continuing to optimize our supply
chain, and shifting our revenue mix to higher-value products. We will remain focused on growing our revenue and profitability by continuing our efforts to
provide IT solutions to our customers in areas such as enterprise solutions and services. In addition, we will continue to utilize our flexible supply chain to
enhance the profitability of our client products.
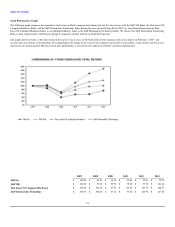
As of February 3, 2012, we had $18.2 billion of total cash, cash equivalents, and investments, compared to $15.1 billion as of January 28, 2011. During Fiscal
2012, we continued to maintain an efficient cash conversion cycle as well as strong cash and investment positions. Cash flow from operations was $5.5
billion, $ 4.0 billion, and $3.9 billion during Fiscal 2012, Fiscal 2011, and Fiscal 2010, respectively. As of February 3, 2012, we had $9.3 billion in total debt,
compared to $6.0 billion in total debt as of January 28, 2011.
In the third quarter of Fiscal 2012, several regions of Thailand experienced severe flooding, causing damage to infrastructure and factories that have
significantly impacted the hard disk drive ("HDD") supply chain. Although we were effective in shaping demand and pricing for hard drive cost increases in
the fourth quarter of Fiscal 2012, we were impacted by the available mix of hard drives, which affected the product configuration mix we were able to sell.
We prioritized high end-drives to our strategic customers, which reduced profitability in our Consumer segment. During the fourth quarter of Fiscal 2012, we
entered into purchase commitments with certain HDD suppliers to ensure continuity of supply for these components. We expect the impact of the HDD
situation to improve as we move through Fiscal 2013. See "Liquidity, Capital Commitments, and Contractual Cash Obligations — Contractual Cash
Obligations" for more information about our purchase commitments.
We believe that we will continue to profitably grow revenue in the long- term through the expansion of our enterprise solutions, services, and product
offerings. We will balance revenue growth with the objective of enhancing operating income and cash flow. We expect that total revenue growth in the first
half of Fiscal 2013 will be challenging, given the existing weakness in our Public segment as well as the uncertain macroeconomic environment.
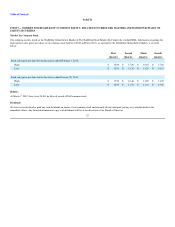
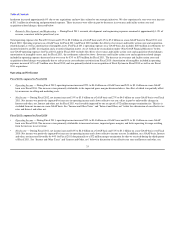
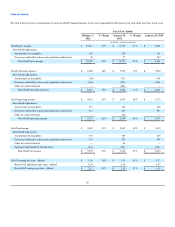
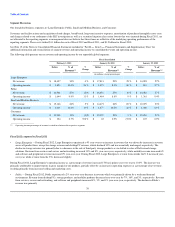
Revenue
Fiscal 2012 compared to Fiscal 2011
•Product Revenue — Product revenue for Fiscal 2012 was essentially unchanged from the prior year. Product revenue increases in our Large Enterprise
and SMB segments were offset by decreases from our Public and Consumer segments. The decline in product revenue from our Public segment was
driven by weakened demand, while the decrease in our Consumer segment revenue was largely attributable to lower average selling prices, partially
offset by an increase in sales of higher-value products.
•Services Revenue, including software related — Services revenue, including software related, increased year-over-year by 6% for Fiscal 2012. Our
services revenue performance during Fiscal 2012 was attributable to a 8% year-over-year increase in services revenue, excluding software related, and
an increase of 1% in software related revenue. All of our Commercial segments experienced increases in services revenue while Consumer services
revenue decreased.
At a regional level, revenue from outside the U.S. increased 7% to $31.7 billion and represented 51% of total net revenue while revenue from the U.S.
decreased 5% to $30.4 billion. Revenue from Growth Countries increased 12% overall year-over-year. In particular, revenue from BRIC increased 15% year-
over-year during Fiscal 2012 and represented 14.2% of our total net revenue for Fiscal 2012, compared to 12.3% for the prior year. We are continuing to
expand into these and other emerging countries that represent the vast majority of the world's population, tailor solutions to meet specific regional needs, and
enhance relationships to provide customer choice and flexibility.
We manage our business on a U.S. dollar basis and factor foreign currency exchange rate movements into our pricing decisions. In addition, we utilize a
comprehensive hedging strategy intended to mitigate the impact of foreign currency volatility over
29