Creative 2005 Annual Report Download - page 16
Download and view the complete annual report
Please find page 16 of the 2005 Creative annual report below. You can navigate through the pages in the report by either clicking on the pages listed below, or by using the keyword search tool below to find specific information within the annual report.-
 1
1 -
2
-
3
-
4
-
5
-
 6
6 -
 7
7 -
 8
8 -
 9
9 -
 10
10 -
 11
11 -
 12
12 -
 13
13 -
 14
14 -
 15
15 -
 16
16 -
 17
17 -
 18
18 -
 19
19 -
 20
20 -
 21
21 -
 22
22 -
 23
23 -
 24
24 -
 25
25 -
 26
26 -
27
-
28
-
29
-
30
-
31
-
32
-
33
-
34
-
35
-
36
-
37
-
38
-
39
-
40
-
41
-
42
-
43
-
44
 |
 |

16
LIQUIDITY AND CAPITAL RESOURCES
Cash and cash equivalents at June 30, 2005 were $187.2 million, a decrease of $23.9 million compared to the balance of
$211.1 million at June 30, 2004.
Operating Activities
Net cash used in operating activities during fiscal year 2005 was $208.5 million compared with $20.7 million in fiscal year
2004. The cash used in operating activities of $208.5 million was mainly due to a $96.2 million net increase in accounts
receivable and other assets and prepaid expenses and a $212.0 million net increase in inventory. As of June 30, 2005,
Creative had $395.9 million in inventory compared to $183.9 million in inventory as of June 30, 2004. Creative built up its
inventory to better position the company to take advantage of the expanding markets for digital audio players and to support
the strong revenue growth that the company expects. However, due to softer than expected demand for digital audio players
in the second half of fiscal year 2005, Creative’s inventory levels were higher than anticipated in the third and fourth quarters.
Cash used in operating activities was offset partially by $19.7 million in adjustments for non-cash items and a net increase
in accounts payable and accrued and other liabilities of $80.5 million. The $19.7 million in adjustments to non-cash items
comprises mainly $27.9 million of depreciation and amortization, $11.6 million in write-offs of investments and other non-
current assets, $85.8 million in net gains from the disposal of investments, and $65.2 million in impairment of goodwill and
intangible assets.
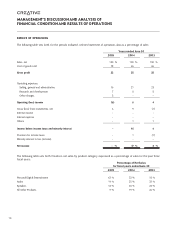
Unaudited data for quarters ended (as a percentage of sales)
Jun 30 Mar 31 Dec 31 Sep 30 Jun 30 Mar 31 Dec 31 Sep 30
2005 2005 2004 2004 2004 2004 2003 2003
Sales, net 100 % 100 % 100 % 100 % 100 % 100 % 100 % 100 %
Cost of goods sold 90 77 73 69 67 66 64 65
Gross profit 10 23 27 31 33 34 36 35
Operating Expenses:
Selling, general and
administrative 16 15 15 19 20 21 19 23
Research and development 6 6 6 10 10 9 7 9
Impairment of goodwill/
intangible assets – – 17–––––
Operating (loss) income (12) 2 (11) 2 3 4 10 3
Net gain (loss) from investments 3 5 14 (1) – 24 1 15
Interest income – – ––11––
Interest expense – – ––––––
Others (2) (2) 1 1 (1) – 2 1
(Loss) income before income
taxes and minority interest (11) 5 4 2 3 29 13 19
Provision for income taxes 1 – (1) – – (1) 4 (1)
Minority interest in (income) loss – – ––––––
Net (loss) income (10) % 5 % 3 % 2 % 3 % 28 % 17 % 18 %
MANAGEMENT’S DISCUSSION AND ANALYSIS OF
FINANCIAL CONDITION AND RESULTS OF OPERATIONS