Creative 2005 Annual Report Download - page 11
Download and view the complete annual report
Please find page 11 of the 2005 Creative annual report below. You can navigate through the pages in the report by either clicking on the pages listed below, or by using the keyword search tool below to find specific information within the annual report.
11
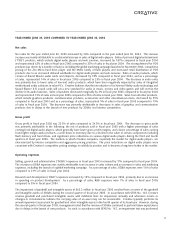
YEAR ENDED JUNE 30, 2005 COMPARED TO YEAR ENDED JUNE 30, 2004
Net sales
Net sales for the year ended June 30, 2005 increased by 50% compared to the year ended June 30, 2004. The revenue
increase was mainly attributable to a substantial increase in sales of digital audio players. Sales of personal digital entertainment
(“PDE”) products, which include digital audio players and web cameras, increased by 187% compared to fiscal year 2004
and represented 63% of sales in fiscal year 2005 compared to 33% of sales in fiscal year 2004. The strong demand for PDE
products was driven by a number of factors, including the global marketing campaign launched in November 2004, competitive
pricing of the Zen Micro hard drive player and the MuVo family of flash players and increased retail distribution of PDE
products due to an increased demand worldwide for digital audio players and web cameras. Sales of audio products, which
consist of Sound Blaster audio cards and chipsets, decreased by 18% compared to fiscal year 2004, and as a percentage
of sales, represented 14% of sales in fiscal year 2005 compared to 25% in fiscal year 2004. The decrease in audio sales
was primarily due to lower sales of low-end audio products, which have been negatively impacted by sales of integrated
motherboard audio solutions in value PCs. Creative believes that the introduction of its Xtreme Fidelity audio technology and
Sound Blaster X-Fi sound cards will set a new standard for audio in music, movies and video games and will reverse the
decline in its audio business. Sales of speakers decreased marginally by 4% in fiscal year 2005 compared to fiscal year 2004
and represented 14% of sales in fiscal year 2005 compared to 23% of sales in fiscal year 2004. Sales from all other products,
which include graphics products, communication products, accessories and other miscellaneous items, decreased by 29%
compared to fiscal year 2004 and as a percentage of sales, represented 9% of sales in fiscal year 2005 compared to 19%
of sales in fiscal year 2004. The decrease was primarily attributable to decreases in sales of graphics and communication
products due to delays in the launch of new products by 3Dlabs and intense competition.
Gross profit
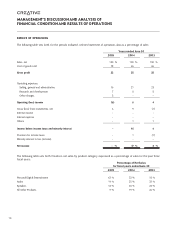
Gross profit in fiscal year 2005 was 22.5% of sales compared to 34.5% in fiscal year 2004. The decrease in gross profit
was primarily attributable to the following: the mix of products sold in fiscal year 2005 with a higher percentage of sales
coming from digital audio players, which generally have lower gross profit margins, and a lower percentage of sales coming
from higher margin audio products; a write down in inventory due to a decline in the value of certain components including
flash memory and hard drives; and significant price reductions on various digital audio players during the third and fourth
quarters of fiscal year 2005. The markets in which Creative competes, especially the market for digital audio players, are
characterized by intense competition and aggressive pricing practices. The price reductions on digital audio players were
consistent with Creative’s competitive pricing strategy to solidify its position and to become a long-term leader in the market.
Operating expenses
Selling, general and administrative (“SG&A”) expenses in fiscal year 2005 increased by 17% compared to fiscal year 2004.
The increase in SG&A expenses was mainly attributable to an increase in sales volume and an increase in sales and marketing
expenses, including the launch of a global marketing campaign. As a percentage of sales, SG&A expenses were 16% of sales
compared to 21% of sales in fiscal year 2004.
Research and development (“R&D”) expenses increased by 18% compared to fiscal year 2004, primarily due to an increase
in spending on product development. As a percentage of sales, R&D expenses were 7% of sales in fiscal year 2005
compared to 8% in fiscal year 2004.
The impairment of goodwill and intangible assets of $65.2 million in fiscal year 2005 resulted from a review of the goodwill
and intangible assets of 3Dlabs during the second quarter of fiscal year 2005. In accordance with SFAS No. 142, Creative
reviews goodwill and purchased intangible assets with indefinite lives for impairment annually and whenever events or
changes in circumstances indicate the carrying value of an asset may not be recoverable. Creative typically performs its
annual impairment assessment for goodwill and other intangible assets in the fourth quarter of its fiscal year. However, during
the second quarter of fiscal year 2005, management noted that the revenue of 3Dlabs continued to perform below expectations
due to delays in the launch of new products. As such, in accordance with SFAS No. 142, an impairment test was performed

