Creative 2005 Annual Report Download - page 10
Download and view the complete annual report
Please find page 10 of the 2005 Creative annual report below. You can navigate through the pages in the report by either clicking on the pages listed below, or by using the keyword search tool below to find specific information within the annual report.-
 1
1 -
 2
2 -
 3
3 -
 4
4 -
 5
5 -
 6
6 -
 7
7 -
 8
8 -
 9
9 -
 10
10 -
 11
11 -
 12
12 -
 13
13 -
 14
14 -
 15
15 -
 16
16 -
 17
17 -
 18
18 -
 19
19 -
 20
20 -
 21
21 -
22
-
23
-
24
-
25
-
26
-
27
-
28
-
29
-
30
-
31
-
32
-
33
-
34
-
35
-
36
-
37
-
38
-
39
-
40
-
41
-
42
-
43
-
44
 |
 |

10
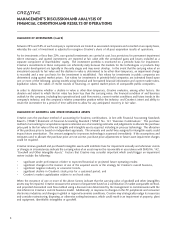
MANAGEMENT’S DISCUSSION AND ANALYSIS OF
FINANCIAL CONDITION AND RESULTS OF OPERATIONS
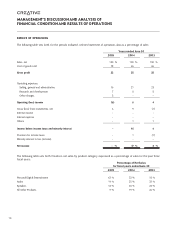
RESULTS OF OPERATIONS
The following table sets forth, for the periods indicated, selected statement of operations data as a percentage of sales:
Years ended June 30
2005 2004 2003
Sales, net 100 % 100 % 100 %
Cost of goods sold 78 65 65
Gross profit 22 35 35
Operating expenses:
Selling, general and administrative 16 21 23
Research and development 7 8 8
Other charges 5 – –
Operating (loss) income (6) 6 4
Gross (loss) from investments, net 6 9 (1)
Interest income – – –
Interest expense – – –
Others –11
Income before income taxes and minority interest – 16 4
Provision for income taxes – 1 (1)
Minority interest in loss (income) – – –
Net income – % 17 % 3 %
The following table sets forth Creative’s net sales by product category expressed as a percentage of sales for the past three
fiscal years:
Percentage of Net Sales
for fiscal years ended June 30
2005 2004 2003
Personal Digital Entertainment 63 % 33 % 18 %
Audio 14 % 25 % 33 %
Speakers 14 % 23 % 23 %
All Other Products 9 % 19 % 26 %