Creative 2005 Annual Report Download - page 15
Download and view the complete annual report
Please find page 15 of the 2005 Creative annual report below. You can navigate through the pages in the report by either clicking on the pages listed below, or by using the keyword search tool below to find specific information within the annual report.
15
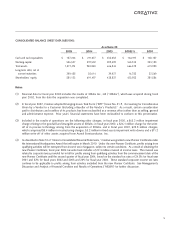
QUARTERLY RESULTS
The following is a summary of Creative’s unaudited quarterly results for the eight quarters ended June 30, 2005, together
with the percentage of sales represented by such results. Consistent with the PC peripherals and digital entertainment
markets, demand for Creative’s products is generally stronger in the quarter ended December 31, compared to any other
quarter of the fiscal year due to consumer buying patterns. In management’s opinion, the results detailed below have been
prepared on a basis consistent with the audited financial statements and include all adjustments, consisting only of normal
recurring adjustments, necessary for a fair presentation of the information for the periods presented when read in conjunction
with the financial statements and notes thereto contained elsewhere herein. Creative’s business is seasonal in nature and
the quarterly results are not necessarily indicative of the results to be achieved in future quarters.
Unaudited data for quarters ended (in US$’000 except per share data)
Jun 30 Mar 31 Dec 31 Sep 30 Jun 30 Mar 31 Dec 31 Sep 30
2005 2005 2004 2004 2004 2004 2003 2003
Sales, net $ 305,409 $ 333,840 $ 375,142 $ 210,020 $ 201,780 $ 201,835 $ 250,422 $ 160,816
Cost of goods sold 274,417 256,519 273,398 144,817 135,393 132,278 161,494 104,348
Gross profit 30,992 77,321 101,744 65,203 66,387 69,557 88,928 56,468
Operating expenses:
Selling, general and
administrative 48,051 51,208 56,931 40,068 40,686 42,477 47,108 37,317
Research and development 20,300 19,687 22,620 19,718 18,940 18,926 16,800 14,838
Other charges – – 65,225 – – – – –
Operating (loss) income (37,359) 6,426 (43,032) 5,417 6,761 8,154 25,020 4,313
Net gain (loss) from investments 9,304 14,766 51,539 (1,204) (224) 48,319 937 23,570
Interest income 967 1,243 651 710 1,719 1,702 546 625
Interest expense (1,792) (1,275) (456) (151) (231) (202) (275) (293)
Others (4,796) (5,728) 5,555 709 (700) 15 4,988 1,382
(Loss) income before income
taxes and minority interest (33,676) 15,432 14,257 5,481 7,325 57,988 31,216 29,597
Provision for income taxes 1,855 (53) (2,236) (535) (604) (773) 10,433 (517)
Minority interest in
(income) loss (123) 534 (178) (170) (90) (168) (165) 5
Net (loss) income $ (31,944) $ 15,913 $ 11,843 $ 4,776 $ 6,631 $ 57,047 $ 41,484 $ 29,085
Basic (loss) earnings per share $ (0.38) $ 0.19 $ 0.14 $ 0.06 $ 0.08 $ 0.70 $ 0.52 $ 0.36
Weighted average ordinary
shares outstanding (’000) 83, 576 83,307 82,320 81,443 81,236 80,955 80,522 79,902
Diluted (loss) earnings per share $ (0.38) $ 0.18 $ 0.14 $ 0.06 $ 0.08 $ 0.68 $ 0.50 $ 0.35
Weighted average ordinary
shares and equivalents
outstanding (’000) 83,576 86,274 85,930 84,237 83,960 84,237 83,683 82,638


