Creative 2005 Annual Report Download - page 12
Download and view the complete annual report
Please find page 12 of the 2005 Creative annual report below. You can navigate through the pages in the report by either clicking on the pages listed below, or by using the keyword search tool below to find specific information within the annual report.-
 1
1 -
 2
2 -
 3
3 -
 4
4 -
 5
5 -
 6
6 -
 7
7 -
 8
8 -
 9
9 -
 10
10 -
 11
11 -
 12
12 -
 13
13 -
 14
14 -
 15
15 -
 16
16 -
 17
17 -
 18
18 -
 19
19 -
 20
20 -
 21
21 -
 22
22 -
23
-
24
-
25
-
26
-
27
-
28
-
29
-
30
-
31
-
32
-
33
-
34
-
35
-
36
-
37
-
38
-
39
-
40
-
41
-
42
-
43
-
44
 |
 |

12
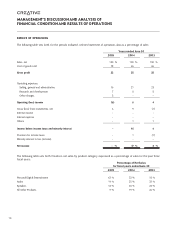
Operating expenses (Cont’d)
on the goodwill and other intangible assets that were acquired in connection with the acquisition of 3Dlabs in May 2002.
An independent assessor was engaged to perform the impairment review. The fair value was determined based on a
combination of the projected discounted cash flow method and the market comparable method whereby market multiples
of 3Dlabs were compared to the market multiples of other publicly traded companies in similar lines of business. The
conclusion of the impairment review was that the fair value of 3Dlabs could no longer support the carrying value of the
remaining goodwill and other intangible assets associated with them. As a result, Creative recorded a goodwill impairment
charge of $62.5 million and other intangible assets impairment charge of $2.7 million in the second quarter of fiscal year
2005 (see Note 3 of “Notes to Consolidated Financial Statements”). As at the end of the fiscal year 2005, Creative concluded
that there had not been any significant change in the fair value of the intangible assets since the second quarter of fiscal year
2005.
Net investment gain (loss)
Net investment gain of $74.4 million in fiscal year 2005 comprised a $86.0 million net gain from sales of investments offset
by $11.6 million in write-downs of investments. The bulk of the net gain from the sales of investments was derived from sales
of shares of SigmaTel, Inc (“SigmaTel”). Net investment gains of $72.6 million in fiscal year 2004 comprised a $52.9 million
net gain from sales of investments and a $23.1 million non-cash gain on a “deemed disposal” of interests in SigmaTel, which
was then an associated company, offset by $3.4 million in write-downs of investments. The “deemed disposal” of interests
in SigmaTel resulted from SigmaTel’s initial public offering of common stock in the United States. As a result of SigmaTel’s
initial public offering, Creative’s ownership percentage in the company was reduced even though Creative did not dispose
any of its shareholdings during the initial public offering. This reduction was treated in accordance with U.S. GAAP as a
“deemed disposal,” which represents the net increase in Creative’s share of the net assets of SigmaTel, as a result of the initial
public offering. The net gain of $52.9 million in fiscal year 2004 from sales of investments includes a $38.1 million net gain
from sales of interests in SigmaTel where it ceased to be an equity-method investee company (see Note 14 of “Notes to
Consolidated Financial Statements”).
As part of its long-term business strategy, from time to time, Creative makes strategic equity investments in companies that
can provide Creative with technologies or products that management believes will give Creative a competitive advantage in
the markets in which Creative competes.
Net interest
Net interest for fiscal year 2005 was an expense of $0.1 million compared to net interest income of $3.6 million for fiscal
year 2004. The decrease in net interest income by $3.7 million was mainly due to lower average cash balance and additional
interest expense arising from the five-year $175.0 million syndicated term loan that was drawn-down in fiscal year 2005.
Others
Others was an expense of $4.3 million in fiscal year 2005 compared to an income of $5.7 million in fiscal year 2004. Net
expense in fiscal year 2005 include an exchange loss of $4.2 million compared to a gain of $4.5 million in fiscal year 2004,
and share of equity-method investees’ losses of $1.6 million in fiscal year 2005 compared to share of equity-method
investees’ gains of $0.3 million in fiscal year 2004.
MANAGEMENT’S DISCUSSION AND ANALYSIS OF
FINANCIAL CONDITION AND RESULTS OF OPERATIONS