CDW 2012 Annual Report Download - page 9
Download and view the complete annual report
Please find page 9 of the 2012 CDW annual report below. You can navigate through the pages in the report by either clicking on the pages listed below, or by using the keyword search tool below to find specific information within the annual report.-
 1
1 -
 2
2 -
 3
3 -
 4
4 -
 5
5 -
 6
6 -
 7
7 -
 8
8 -
 9
9 -
 10
10 -
 11
11 -
 12
12 -
 13
13 -
 14
14 -
 15
15 -
 16
16 -
 17
17 -
 18
18 -
 19
19 -
 20
20 -
21
-
22
-
23
-
24
-
25
-
26
-
27
-
28
-
29
-
30
-
31
-
32
-
33
-
34
-
35
-
36
-
37
-
38
-
39
-
40
-
41
-
42
-
43
-
44
-
45
-
46
-
47
-
48
-
49
-
50
-
51
-
52
-
53
-
54
-
55
-
56
-
57
-
58
-
59
-
60
-
61
-
62
-
63
-
64
-
65
-
66
-
67
-
68
-
69
-
70
-
71
-
72
-
73
-
74
-
75
-
76
-
77
-
78
-
79
-
80
-
81
-
82
-
83
-
84
-
85
-
86
-
87
-
88
-
89
-
90
-
91
-
92
-
93
-
94
-
95
-
96
-
97
-
98
-
99
-
100
-
101
-
102
-
103
-
104
-
105
-
106
-
107
-
108
-
109
-
110
-
111
-
112
-
113
-
114
-
115
-
116
-
117
-
118
-
119
-
120
-
121
-
122
-
123
-
124
-
125
-
126
-
127
-
128
-
129
-
130
-
131
-
132
-
133
-
134
-
135
-
136
-
137
-
138
-
139
-
140
-
141
-
142
-
143
-
144
-
145
-
146
-
147
-
148
-
149
-
150
-
151
-
152
-
153
-
154
-
155
-
156
-
157
-
158
-
159
-
160
-
161
-
162
-
163
-
164
-
165
-
166
-
167
-
168
-
169
-
170
-
171
-
172
-
173
-
174
-
175
-
176
-
177
-
178
-
179
-
180
-
181
-
182
-
183
-
184
-
185
-
186
-
187
-
188
-
189
-
190
-
191
-
192
-
193
-
194
-
195
-
196
-
197
-
198
-
199
-
200
-
201
-
202
-
203
-
204
-
205
-
206
-
207
-
208
-
209
-
210
-
211
-
212
-
213
-
214
-
215
-
216
-
217
 |
 |

Table of Contents
• Data Center Optimization : We help our customers evaluate their data centers for convergence and optimization
opportunities. Our data center optimization solutions consist of server virtualization, physical server consolidation, data storage
management and energy-efficient power and cooling systems.
• Cloud Computing : Cloud computing is a combination of software and computing delivered on demand as a service. We
provide SaaS and IaaS solutions that reside in the public cloud, meaning any person or organization interested in porting applications
and resources to an external “public” cloud system can do so. Likewise, we provide similar private cloud-based solutions to our
customers that prefer to avoid running their infrastructure on a shared public platform but want to obtain the flexibility, scalability and
access offered by cloud computing and collaboration.
• Virtualization : We design and implement server, storage and desktop virtualization solutions. Virtualization enables our
customers to efficiently utilize hardware resources by running multiple, independent, virtual operating systems on a single computer
and multiple virtual servers simultaneously on a single server. Virtualization also can separate a desktop environment and associated
application software from the hardware device that is used to access it, and provides employees with remote desktop access. Our
specialists assist customers with the steps of implementing virtualization solutions, including evaluating network environments,
deploying shared storage options and licensing platform software.
• Collaboration : We provide our customers with communication tools that allow employees to share knowledge, ideas and
information among each other and with clients and partners effectively and quickly. Our collaboration solutions unite communications
and applications via the integration of products that facilitate the use of multiple enterprise communication methods including email,
instant messaging, presence, social media, voice, video, hardware, software and services. We also host cloud-based collaboration
solutions.
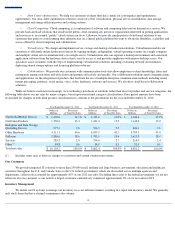
While we believe customers increasingly view technology purchases as solutions rather than discrete product and service categories, the
following table shows our net sales by major category, based upon our internal category classifications. Prior period amounts have been
reclassified for changes in individual product classifications to conform to the presentation for the year ended December 31, 2012.
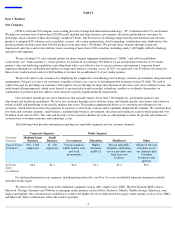
Our Customers
We provide integrated IT solutions to more than 250,000 small, medium and large business, government, education and healthcare
customers throughout the U.S. and Canada. Sales to the U.S. federal government, which are diversified across multiple agencies and
departments, collectively accounted for approximately 10% of our 2012 net sales. Excluding these sales to the federal government, we are not
reliant on any one customer, as our next five largest customers cumulatively comprised approximately 2% of our net sales in 2012.
Inventory Management
We utilize our IT systems to manage our inventory in a cost-efficient manner, resulting in a rapid-turn inventory model. We generally
only stock items that have attained a minimum sales volume.
6
Year Ended December 31, 2012
Year Ended December 31, 2011
Year Ended December 31, 2010
Dollars in
Millions
Percentage
of Total Net Sales
Dollars in
Millions
Percentage
of Total Net Sales
Dollars in
Millions
Percentage
of Total Net Sales
Notebooks/Mobile Devices
$
1,470.8
14.5
%
$
1,333.8
13.9
%
$
1,142.6
13.0
%
NetComm Products
1,350.6
13.3
1,241.4
12.9
1,142.0
13.0
Enterprise and Data Storage
(Including Drives)
975.1
9.6
916.9
9.5
844.1
9.6
Other Hardware
4,111.1
40.6
4,039.2
42.1
3,783.5
43.0
Software
1,886.6
18.6
1,781.6
18.6
1,621.8
18.4
Services
285.2
2.8
254.6
2.7
214.9
2.4
Other
(1)
48.8
0.6
34.9
0.3
52.3
0.6
Total net sales
$
10,128.2
100.0
%
$
9,602.4
100.0
%
$
8,801.2
100.0
%
(1)
Includes items such as delivery charges to customers and certain commission revenue.