Barclays 2003 Annual Report Download - page 8
Download and view the complete annual report
Please find page 8 of the 2003 Barclays annual report below. You can navigate through the pages in the report by either clicking on the pages listed below, or by using the keyword search tool below to find specific information within the annual report.-
 1
1 -
 2
2 -
 3
3 -
 4
4 -
 5
5 -
 6
6 -
 7
7 -
 8
8 -
 9
9 -
 10
10 -
 11
11 -
 12
12 -
 13
13 -
 14
14 -
 15
15 -
 16
16 -
 17
17 -
 18
18 -
 19
19 -
20
-
21
-
22
-
23
-
24
-
25
-
26
-
27
-
28
-
29
-
30
-
31
-
32
-
33
-
34
-
35
-
36
-
37
-
38
-
39
-
40
-
41
-
42
-
43
-
44
-
45
-
46
-
47
-
48
-
49
-
50
-
51
-
52
-
53
-
54
-
55
-
56
-
57
-
58
-
59
-
60
-
61
-
62
-
63
-
64
-
65
-
66
-
67
-
68
-
69
-
70
-
71
-
72
-
73
-
74
-
75
-
76
-
77
-
78
-
79
-
80
-
81
-
82
-
83
-
84
-
85
-
86
-
87
-
88
-
89
-
90
-
91
-
92
-
93
-
94
-
95
-
96
-
97
-
98
-
99
-
100
-
101
-
102
-
103
-
104
-
105
-
106
-
107
-
108
-
109
-
110
-
111
-
112
-
113
-
114
-
115
-
116
-
117
-
118
-
119
-
120
-
121
-
122
-
123
-
124
-
125
-
126
-
127
-
128
-
129
-
130
-
131
-
132
-
133
-
134
-
135
-
136
-
137
-
138
-
139
-
140
-
141
-
142
-
143
-
144
-
145
-
146
-
147
-
148
-
149
-
150
-
151
-
152
-
153
-
154
-
155
-
156
-
157
-
158
-
159
-
160
-
161
-
162
-
163
-
164
-
165
-
166
-
167
-
168
-
169
-
170
-
171
-
172
-
173
-
174
-
175
-
176
-
177
-
178
-
179
-
180
-
181
-
182
-
183
-
184
-
185
-
186
-
187
-
188
-
189
-
190
-
191
-
192
-
193
-
194
-
195
-
196
-
197
-
198
-
199
-
200
-
201
-
202
-
203
-
204
-
205
-
206
-
207
-
208
-
209
-
210
-
211
-
212
-
213
-
214
-
215
-
216
-
217
-
218
-
219
-
220
-
221
-
222
-
223
-
224
-
225
-
226
-
227
-
228
-
229
-
230
-
231
-
232
 |
 |

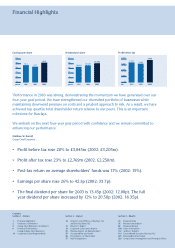
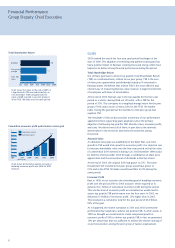
Dividend per share
Post tax return on average shareholders’ funds
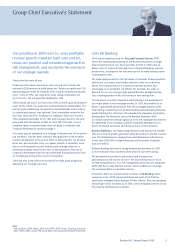
Barclays delivered a strong financial
performance in 2003. It was a year in which
most of our businesses performed well. 2003
was also the final year of our four-year goal
period 2000 to 2003, and we achieved our
primary objective of delivering top quartile total
shareholder return relative to our peer group of
UK and international banks.
Profit before tax at £3,845 million was up 20%. Return on average
shareholders’ funds was 17% and the total dividend payout for the year
rose 12%. Our capital position remained healthy, with a tier 1 ratio
of 7.9%.
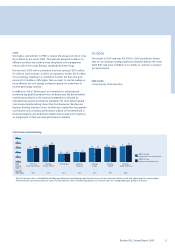
Income rose 10%. This increase was broadly based and was the main
driver of the Group’s strong 2003 performance. Expenses increased by
9%. One-third of this increase was attributable to moving from a
pensions credit in 2002 to a pensions charge in 2003. The cost:income
ratio was maintained at 58%. Provisions fell by 9%, reflecting, in
particular, the much improved credit environment in both the UK and
the US. In 2002, provisions were adversely affected by the charge against
loans in Argentina; excluding this, the like for like provisions charge fell
3%, comfortably below the increase in our loan book, which grew 11%.
Business Performance
Personal Financial Services grew profit before tax by 15%, driven
primarily by good income growth of 7%. Expenses increased 7%, with
almost two-thirds of the increase attributable to the pensions charge
and higher strategic investment spend. Strategic investment was
directed, in particular, at improvements to the branch network and
information technology capability. Provisions fell 9%, reflecting the
overall quality of the loan portfolio and improvements to risk
management processes.
In Barclays Private Clients, profit before tax fell 4%. Income fell during
the year as a consequence of the double burden of low interest rates and
lower average stock market levels. However, performance strengthened
during the second half of 2003, with early signs that an improving
economic climate and a sharper focus within the business were
delivering results. Expenses remained well managed, increasing 1%.
The results included both the income and cost impact of acquiring
Charles Schwab Europe, Banco Zaragozano and Gerrard.
Barclaycard delivered a 17% increase in profit before tax, maintaining
the strong momentum of the previous three years. This was driven by
16% income growth, achieved through record levels of new customer
recruitment and increased lending. Provisions rose 15%, consistent
with growth in business activity. Expenses grew 16% reflecting the
year-on-year impact of the pensions charge, increased business volumes
and investment in both the UK and international businesses. Good
progress has been achieved through non-organic activity during 2003:
6
0
5
10
%
15
25
20
2001
17
2002
15
2003
17
0
5
10
pence
15
25
20
2001
16.625
2002
18.350
2003
20.500
Profit before tax
Financial Performance
Group Deputy Chief Executive
0
1,000
2,000
£m
3,000
4,000
2001
3,425
2002
3,205
2003
3,845