Barclays 2003 Annual Report Download - page 10
Download and view the complete annual report
Please find page 10 of the 2003 Barclays annual report below. You can navigate through the pages in the report by either clicking on the pages listed below, or by using the keyword search tool below to find specific information within the annual report.-
 1
1 -
 2
2 -
 3
3 -
 4
4 -
 5
5 -
 6
6 -
 7
7 -
 8
8 -
 9
9 -
 10
10 -
 11
11 -
 12
12 -
 13
13 -
 14
14 -
 15
15 -
 16
16 -
 17
17 -
 18
18 -
 19
19 -
 20
20 -
 21
21 -
22
-
23
-
24
-
25
-
26
-
27
-
28
-
29
-
30
-
31
-
32
-
33
-
34
-
35
-
36
-
37
-
38
-
39
-
40
-
41
-
42
-
43
-
44
-
45
-
46
-
47
-
48
-
49
-
50
-
51
-
52
-
53
-
54
-
55
-
56
-
57
-
58
-
59
-
60
-
61
-
62
-
63
-
64
-
65
-
66
-
67
-
68
-
69
-
70
-
71
-
72
-
73
-
74
-
75
-
76
-
77
-
78
-
79
-
80
-
81
-
82
-
83
-
84
-
85
-
86
-
87
-
88
-
89
-
90
-
91
-
92
-
93
-
94
-
95
-
96
-
97
-
98
-
99
-
100
-
101
-
102
-
103
-
104
-
105
-
106
-
107
-
108
-
109
-
110
-
111
-
112
-
113
-
114
-
115
-
116
-
117
-
118
-
119
-
120
-
121
-
122
-
123
-
124
-
125
-
126
-
127
-
128
-
129
-
130
-
131
-
132
-
133
-
134
-
135
-
136
-
137
-
138
-
139
-
140
-
141
-
142
-
143
-
144
-
145
-
146
-
147
-
148
-
149
-
150
-
151
-
152
-
153
-
154
-
155
-
156
-
157
-
158
-
159
-
160
-
161
-
162
-
163
-
164
-
165
-
166
-
167
-
168
-
169
-
170
-
171
-
172
-
173
-
174
-
175
-
176
-
177
-
178
-
179
-
180
-
181
-
182
-
183
-
184
-
185
-
186
-
187
-
188
-
189
-
190
-
191
-
192
-
193
-
194
-
195
-
196
-
197
-
198
-
199
-
200
-
201
-
202
-
203
-
204
-
205
-
206
-
207
-
208
-
209
-
210
-
211
-
212
-
213
-
214
-
215
-
216
-
217
-
218
-
219
-
220
-
221
-
222
-
223
-
224
-
225
-
226
-
227
-
228
-
229
-
230
-
231
-
232
 |
 |

Financial Performance
Group Deputy Chief Executive
Goals
2003 marked the end of the four-year goal period that began at the
start of 2000. The adoption of stretching and publicly stated goals has
had a positive impact in Barclays, creating focus and energy which have
helped us to deliver strong financial performance during the period.
Total Shareholder Return
Our primary goal was to achieve top quartile Total Shareholder Return
(TSR) on a sustained basis, relative to our peer group. TSR is the sum
of share price appreciation and dividends treated as if reinvested in
Barclays shares. We believe that relative TSR is the most effective and
relevant way of measuring Barclays value creation. It aligns the interests
of employees with those of shareholders.
At the end of 2003, Barclays was in the top quartile for the four-year
period as a whole, ranking third out of twelve, with a TSR for the
period of 31%. This compares to a weighted average return for the peer
group of 16% and a return of minus 28% for the FTSE 100 market
Index. During the goal period, five members of the peer group had
negative TSR.
The remainder of this section provides a summary of our performance
against the three supporting goals adopted to drive the primary
objective of delivering top quartile TSR: absolute value; economic profit;
and costs. We did not meet all of them, in part due to the dramatic
deterioration in the economic and market environment during
the period.
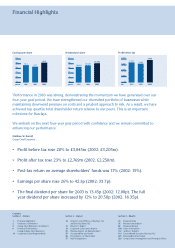
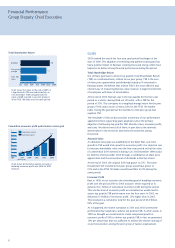
Absolute Value
An absolute value goal was established in the belief that, over time,
growth in TSR would track growth in economic profit. Our objective was
to increase shareholder value over the four-year period so that the value
of a theoretical £100 invested in Barclays on 31st December 1999 would
be £200 by 31st December 2003 through a combination of share price
appreciation and the reinvestment of dividends in Barclays shares.
At the end of 2003, the original £100 had grown to £131. The same
theoretical £100 invested in the peer group would have grown to
£116 and in the FTSE 100 Index would have fallen to £72 during the
same period.
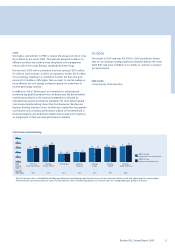
Economic Profit
Back in 1999, we set ourselves the stretching goal of doubling economic
profit over the period 2000 to 2003 inclusive, which required us to
generate £6.1 billion of cumulative economic profit during the period.
This was the level of economic profit we estimated we would need to
assure top quartile TSR performance over the four years. In 2003, we
delivered £1.4 billion of economic profit, 15% higher than in 2002.
This resulted in a cumulative total for the goal period of £5.3 billion,
87% of the goal.
As it happened, the market turndown in 2001 and 2002 lowered the
performance bar required to achieve top quartile TSR. In other words, in
1999 we thought we would need to create compound growth in
economic profit of 19% to deliver top quartile TSR. In fact we generated
13% per annum but that was sufficient to achieve the relative ranking of
a top three position among the peer group of twelve organisations.
8
Total Shareholder Return
Cumulative economic profit performance versus goal
0
2
1
3
4
1999 2001 2002£bn
5
7
6
1.0 2.7
2003
3.9
1.2
1.0
2.5
4.2
6.1
Chart shows performance against our goal of
doubling economic profit over 2000 to 2003
inclusive.
Cumulative actual
Cumulative goal
5.3
2000
1.4
(base year)
£0 £25 £50 £100 £125£75 £150
FTSE 100
Index 72
Peer group
average 116
Barclays 131
Chart shows the value, at the end of 2003, of
a hypothetical £100 invested in Barclays on
31st December 1999 compared with the
value of £100 invested in our peer group or
in the FTSE 100 Index over the same period.