Barclays 2003 Annual Report Download - page 3
Download and view the complete annual report
Please find page 3 of the 2003 Barclays annual report below. You can navigate through the pages in the report by either clicking on the pages listed below, or by using the keyword search tool below to find specific information within the annual report.-
 1
1 -
 2
2 -
 3
3 -
 4
4 -
 5
5 -
 6
6 -
 7
7 -
 8
8 -
 9
9 -
 10
10 -
 11
11 -
 12
12 -
 13
13 -
 14
14 -
15
-
16
-
17
-
18
-
19
-
20
-
21
-
22
-
23
-
24
-
25
-
26
-
27
-
28
-
29
-
30
-
31
-
32
-
33
-
34
-
35
-
36
-
37
-
38
-
39
-
40
-
41
-
42
-
43
-
44
-
45
-
46
-
47
-
48
-
49
-
50
-
51
-
52
-
53
-
54
-
55
-
56
-
57
-
58
-
59
-
60
-
61
-
62
-
63
-
64
-
65
-
66
-
67
-
68
-
69
-
70
-
71
-
72
-
73
-
74
-
75
-
76
-
77
-
78
-
79
-
80
-
81
-
82
-
83
-
84
-
85
-
86
-
87
-
88
-
89
-
90
-
91
-
92
-
93
-
94
-
95
-
96
-
97
-
98
-
99
-
100
-
101
-
102
-
103
-
104
-
105
-
106
-
107
-
108
-
109
-
110
-
111
-
112
-
113
-
114
-
115
-
116
-
117
-
118
-
119
-
120
-
121
-
122
-
123
-
124
-
125
-
126
-
127
-
128
-
129
-
130
-
131
-
132
-
133
-
134
-
135
-
136
-
137
-
138
-
139
-
140
-
141
-
142
-
143
-
144
-
145
-
146
-
147
-
148
-
149
-
150
-
151
-
152
-
153
-
154
-
155
-
156
-
157
-
158
-
159
-
160
-
161
-
162
-
163
-
164
-
165
-
166
-
167
-
168
-
169
-
170
-
171
-
172
-
173
-
174
-
175
-
176
-
177
-
178
-
179
-
180
-
181
-
182
-
183
-
184
-
185
-
186
-
187
-
188
-
189
-
190
-
191
-
192
-
193
-
194
-
195
-
196
-
197
-
198
-
199
-
200
-
201
-
202
-
203
-
204
-
205
-
206
-
207
-
208
-
209
-
210
-
211
-
212
-
213
-
214
-
215
-
216
-
217
-
218
-
219
-
220
-
221
-
222
-
223
-
224
-
225
-
226
-
227
-
228
-
229
-
230
-
231
-
232
 |
 |

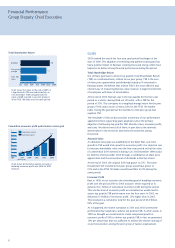
Earnings per share
Contents
Section 1 – Review
1Financial Highlights
2Chairman’s Statement
3Group Chief Executive’s Statement
6Financial Performance
Group Deputy Chief Executive
10 Corporate Social Responsibility
Section 2 – Impact
14 Directors and Officers of Barclays PLC
and Barclays Bank PLC
17 Directors’ Report
19 Corporate Governance Report
23 Barclays Report on Remuneration
35 Accountability and Audit
36 Presentation of Information
37 Risk Management
Section 3 – Results
73 Financial Data
76 Business Description
82 Financial Review
108 Other Information
112 Auditors’ Reports
114 Consolidated Accounts Barclays PLC
219 Shareholder Information
226 Group Senior Management and Principal Offices
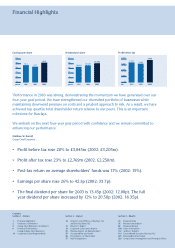
Financial Highlights
0
10
20
pence
30
40
50
2001
36.8
2002
33.7
2003
42.3
Dividend per share Profit before tax
0
1,000
2,000
£m
3,000
4,000
2001
3,425
2002
3,205
2003
3,845
‘Performance in 2003 was strong, demonstrating the momentum we have generated over our
four-year goal period. We have strengthened our diversified portfolio of businesses while
maintaining downward pressure on costs and a prudent approach to risk. As a result, we have
achieved top quartile total shareholder return relative to our peers. This is an important
milestone for Barclays.
We embark on the next four-year goal period with confidence and we remain committed to
enhancing our performance.’
Matthew W. Barrett
Group Chief Executive
•Profit before tax rose 20% to £3,845m (2002: £3,205m).
•Profit after tax rose 23% to £2,769m (2002: £2,250m).
• Post-tax return on average shareholders’ funds was 17% (2002: 15%).
•Earnings per share rose 26% to 42.3p (2002: 33.7p).
• The final dividend per share for 2003 is 13.45p (2002: 12.00p). The full
year dividend per share increased by 12% to 20.50p (2002: 18.35p).
0
5
10
pence
15
25
20
2001
16.625
2002
18.350
2003
20.500