BP 2010 Annual Report Download - page 43
Download and view the complete annual report
Please find page 43 of the 2010 BP annual report below. You can navigate through the pages in the report by either clicking on the pages listed below, or by using the keyword search tool below to find specific information within the annual report.-
 1
1 -
2
-
3
-
4
-
5
-
6
-
7
-
8
-
9
-
10
-
11
-
12
-
13
-
14
-
15
-
16
-
17
-
18
-
19
-
20
-
21
-
22
-
23
-
24
-
25
-
26
-
27
-
28
-
29
-
30
-
31
-
32
-
 33
33 -
 34
34 -
 35
35 -
 36
36 -
 37
37 -
 38
38 -
 39
39 -
 40
40 -
 41
41 -
 42
42 -
 43
43 -
 44
44 -
 45
45 -
 46
46 -
 47
47 -
 48
48 -
 49
49 -
 50
50 -
 51
51 -
 52
52 -
 53
53 -
54
-
55
-
56
-
57
-
58
-
59
-
60
-
61
-
62
-
63
-
64
-
65
-
66
-
67
-
68
-
69
-
70
-
71
-
72
-
73
-
74
-
75
-
76
-
77
-
78
-
79
-
80
-
81
-
82
-
83
-
84
-
85
-
86
-
87
-
88
-
89
-
90
-
91
-
92
-
93
-
94
-
95
-
96
-
97
-
98
-
99
-
100
-
101
-
102
-
103
-
104
-
105
-
106
-
107
-
108
-
109
-
110
-
111
-
112
-
113
-
114
-
115
-
116
-
117
-
118
-
119
-
120
-
121
-
122
-
123
-
124
-
125
-
126
-
127
-
128
-
129
-
130
-
131
-
132
-
133
-
134
-
135
-
136
-
137
-
138
-
139
-
140
-
141
-
142
-
143
-
144
-
145
-
146
-
147
-
148
-
149
-
150
-
151
-
152
-
153
-
154
-
155
-
156
-
157
-
158
-
159
-
160
-
161
-
162
-
163
-
164
-
165
-
166
-
167
-
168
-
169
-
170
-
171
-
172
-
173
-
174
-
175
-
176
-
177
-
178
-
179
-
180
-
181
-
182
-
183
-
184
-
185
-
186
-
187
-
188
-
189
-
190
-
191
-
192
-
193
-
194
-
195
-
196
-
197
-
198
-
199
-
200
-
201
-
202
-
203
-
204
-
205
-
206
-
207
-
208
-
209
-
210
-
211
-
212
-
213
-
214
-
215
-
216
-
217
-
218
-
219
-
220
-
221
-
222
-
223
-
224
-
225
-
226
-
227
-
228
-
229
-
230
-
231
-
232
-
233
-
234
-
235
-
236
-
237
-
238
-
239
-
240
-
241
-
242
-
243
-
244
-
245
-
246
-
247
-
248
-
249
-
250
-
251
-
252
-
253
-
254
-
255
-
256
-
257
-
258
-
259
-
260
-
261
-
262
-
263
-
264
-
265
-
266
-
267
-
268
-
269
-
270
-
271
-
272
 |
 |

Businessreview
Business review
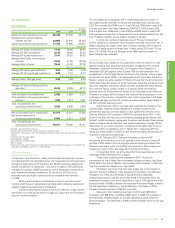
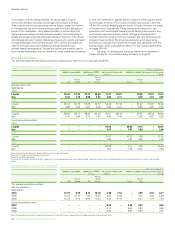
Our performance
Key statistics
$million
2010 2009 2008
Salesandotheroperatingrevenuesa66,266 57,626 86,170
Replacementcostprotbefore
interestandtaxb30,886 24,800 38,308
Capitalexpenditureandacquisitions 17,753 14,896 22,227
$perbarrel
AverageBPcrudeoilrealizationsc77.54 59.86 95.43
AverageBPNGLrealizationsc42.78 29.60 52.30
AverageBPliquidsrealizationscd73.41 56.26 90.20
AverageWestTexasIntermediate
oilpricee79.45 61.92 100.06
AverageBrentoilpricee79.50 61.67 97.26
$perthousandcubicfeet
AverageBPnaturalgasrealizationsc3.97 3.25 6.00
AverageBPUSnaturalgasrealizationsc3.88 3.07 6.77
$permillionBritishthermalunits
AverageHenryHubgaspricef4.39 3.99 9.04
pencepertherm
AverageUKNationalBalancingPoint
gaspricee42.45 30.85 58.12
thousandbarrelsofoilequivalentperday
Totalproductionforsubsidiariesgh2,492 2,684 2,517
Totalproductionforequity-accounted
entitiesgh1,330 1,314 1,321
Totalofsubsidiariesand
equity-accountedentitiesgh3,822 3,998 3,838
millionbarrelsofoilequivalent
Netprovedreservesforsubsidiaries 12,077 12,621 12,562
Netprovedreservesfor
equity-accountedentities 5,994 5,671 5,585
Totalofsubsidiariesand
equity-accountedentities 18,071 18,292 18,147
aIncludessalesbetweenbusinesses.
bIncludesprotafterinterestandtaxofequity-accountedentities.
cRealizationsarebasedonsalesofconsolidatedsubsidiariesonly,whichexcludesequity-accounted
entities.
dCr
udeoilandnaturalgasliquids.
eAlltradeddaysaverage.
fHenryHubFirstofMonthIndex.
gNetofroyalties.
hExpressedinthousandsofbarrelsofoilequivalentperday(mboe/d).Naturalgasisconvertedtooil
equivalentat5.8billioncubicfeet=1millionbarrels.
2010performance
Safety and operational risk
InExplorationandProduction,safety,bothprocessandpersonal,remains
ourhighestpriority.Asdescribedabove,theorganizationalandgovernance
changesinExplorationandProductionandS&ORhavebeendesignedto
ensureweachieveourobjectivesinthisarea.Inaddition,BP’soperating
managementsystem(OMS)providesuswithasystematicframeworkfor
safe,reliableandefcientoperations.Bytheendof2010allofour
explorationandproductionoperationshadcompletedtheirtransition
toOMS.
Safetyperformanceismonitoredbyasuiteofinputandoutput
metricswhichfocusonpersonalandprocesssafetyincludingoperational
integrity,healthandallaspectsofcompliance.
In2010,excludingtheimpactoftheGulfofMexicooilspill,further
informationonwhichcanbefoundonpage34,ExplorationandProduction
hadoneworkforcefatality.
Therecordableinjuryfrequency(RIF),whichmeasuresthenumberof
recordableinjuriestotheBPworkforceper200,000hoursworked,was
0.32.Thisislowerthan2009whenitwas0.39and2008whenitwas0.43.
Ourdayawayfromworkcasefrequency(DAFWCF)in2010was0.063.
Thisishigherthan2009whenitwas0.038and2008whenitwas0.057.
Thisincreaseislargelyduetoday-away-from-workcasesresultingfromthe
GulfofMexicoincidentandanaviationincidentinCanada.
In2010,thenumberofreportedLossofPrimaryContainment
(LOPC)incidentsinExplorationandProductionwas194,downfrom321in
2009.ExcludingtheimpactoftheGulfofMexicoincident,thenumberof
reportedoilspillsequaltoorlargerthan1barrelduring2010was116,up
from112in2009.Thisistherstyearsince1999thatthenumberof
reportedspillshasincreased.
Financial and operating performance
Wecontinuallyseekaccesstoresourcesandin2010,inadditiontonew
accessresultingfromacquisitionsasdetailedonpage43,thisincluded
Azerbaijan,whereBPandtheStateOilCompanyoftheRepublicof
Azerbaijan(SOCAR)signedanew30-yearPSAonjointexplorationand
developmentoftheShafag-AsimanstructureintheCaspian;China,where
wefarmedintoBlock42/05inthedeepwaterSouthChinaSea;theGulfof
Mexico,wherewewereawarded18blocksthroughtheOuterContinental
ShelfLeaseSale213,elevenofwhichhavebeenexecutedandsevenhave
yettobeexecuted;Indonesia,wherewewereawardedtheNorthArafura
PSConshorePapua;Jordan,whereon3January2010,wereceived
approvalfromtheGovernmentofJordantojointhestate-ownedNational
PetroleumCompany(NPC)toexploittheonshoreRishaconcessioninthe
northeastofthecountry;onshoreUS,withfurtherpropertiesintheEagle
Fordshalegasplay;andtheUK,wherewewereawardedsevenblocksin
the26thoffshorelicensinground.
Sincethestartof2011,wehavebeenawardedfourblocksinthe
CedunaBasin,offshoreSouthAustraliaand,subjecttopartnerand
governmentapproval,wehavesignedanewagreementwiththeChina
NationalOffshoreOilCorporation(CNOOC)toexploreBlock43/11inthe
SouthChinaSea.Wehavealsoannouncedastrategicglobalalliancewith
Rosneft,whichincludesanagreementtoexploreanddevelopthreelicence
blocksinRussia’sSouthKaraSea.SeeLegalproceedingsonpage133for
informationonaninteriminjunction,grantedbytheEnglishHighCourton
1February2011andeffectiveuntil11March2011,restrainingBPfrom
takinganyfurtherstepsinrelationtotheRosnefttransactionspendingthe
outcomeofarbitrationproceedings.
On21February2011,RelianceIndustriesLimitedandBP
announcedtheirintentiontoformanupstreamjointventureinwhichBP
willtakea30%stakein23oilandgasproduction-sharingcontractsthat
RelianceoperatesinIndia,anda50:50jointventureforthesourcingand
marketingofgasinIndia.Seepage43forfurtherinformation.
InNovember2010,weannouncedtheHodoagasdiscoveryinthe
deepwaterWestNileDeltaareaofEgypt.
Threemajorprojectscameonstreamin2010.Production
commencedattheInSalahGascompressionprojectinAlgeria,theGreat
WhiteeldintheGulfofMexico,andtheNoeleldinCanada.In2010we
tooknalinvestmentdecisionson15projects.
Productionwaslowerthanlastyear,largelyduetotheimpactof
eventsintheGulfofMexico.Afteradjustingfortheeffectofentitlement
changesinourPSAsandtheeffectofacquisitionsanddisposals,
underlyingproductionwas2%lowerthan2009.InDecember2010,we
sustainedproductionfromtheRumailaeldinIraqat10%abovetheinitial
productionratein2009toachievetheImprovedProductionTarget,whichis
therstsignicantmilestoneintherehabilitationofRumaila.In2010,
full-yearproductiongrowthinTNK-BPwas2.5%.
Salesandotheroperatingrevenuesfor2010were$66billion,
comparedwith$58billionin2009and$86billionin2008.Theincreasein
2010primarilyreectedhigheroilandgasrealizations,partlyoffsetby
lowerproduction.Thedecreasein2009primarilyreectedloweroilandgas
realizations.
BPAnnualReportandForm20-F2010 41