BP 2010 Annual Report Download - page 246
Download and view the complete annual report
Please find page 246 of the 2010 BP annual report below. You can navigate through the pages in the report by either clicking on the pages listed below, or by using the keyword search tool below to find specific information within the annual report.-
 1
1 -
2
-
3
-
4
-
5
-
6
-
7
-
8
-
9
-
10
-
11
-
12
-
13
-
14
-
15
-
16
-
17
-
18
-
19
-
20
-
21
-
22
-
23
-
24
-
25
-
26
-
27
-
28
-
29
-
30
-
31
-
32
-
33
-
34
-
35
-
36
-
37
-
38
-
39
-
40
-
41
-
42
-
43
-
44
-
45
-
46
-
47
-
48
-
49
-
50
-
51
-
52
-
53
-
54
-
55
-
56
-
57
-
58
-
59
-
60
-
61
-
62
-
63
-
64
-
65
-
66
-
67
-
68
-
69
-
70
-
71
-
72
-
73
-
74
-
75
-
76
-
77
-
78
-
79
-
80
-
81
-
82
-
83
-
84
-
85
-
86
-
87
-
88
-
89
-
90
-
91
-
92
-
93
-
94
-
95
-
96
-
97
-
98
-
99
-
100
-
101
-
102
-
103
-
104
-
105
-
106
-
107
-
108
-
109
-
110
-
111
-
112
-
113
-
114
-
115
-
116
-
117
-
118
-
119
-
120
-
121
-
122
-
123
-
124
-
125
-
126
-
127
-
128
-
129
-
130
-
131
-
132
-
133
-
134
-
135
-
136
-
137
-
138
-
139
-
140
-
141
-
142
-
143
-
144
-
145
-
146
-
147
-
148
-
149
-
150
-
151
-
152
-
153
-
154
-
155
-
156
-
157
-
158
-
159
-
160
-
161
-
162
-
163
-
164
-
165
-
166
-
167
-
168
-
169
-
170
-
171
-
172
-
173
-
174
-
175
-
176
-
177
-
178
-
179
-
180
-
181
-
182
-
183
-
184
-
185
-
186
-
187
-
188
-
189
-
190
-
191
-
192
-
193
-
194
-
195
-
196
-
197
-
198
-
199
-
200
-
201
-
202
-
203
-
204
-
205
-
206
-
207
-
208
-
209
-
210
-
211
-
212
-
213
-
214
-
215
-
216
-
217
-
218
-
219
-
220
-
221
-
222
-
223
-
224
-
225
-
226
-
227
-
228
-
229
-
230
-
231
-
232
-
233
-
234
-
235
-
 236
236 -
 237
237 -
 238
238 -
 239
239 -
 240
240 -
 241
241 -
 242
242 -
 243
243 -
 244
244 -
 245
245 -
 246
246 -
 247
247 -
 248
248 -
 249
249 -
 250
250 -
 251
251 -
 252
252 -
 253
253 -
 254
254 -
 255
255 -
 256
256 -
257
-
258
-
259
-
260
-
261
-
262
-
263
-
264
-
265
-
266
-
267
-
268
-
269
-
270
-
271
-
272
 |
 |

Supplementaryinformationonoilandnaturalgas(unaudited)
Supplementaryinformationonoilandnaturalgas(unaudited)continued
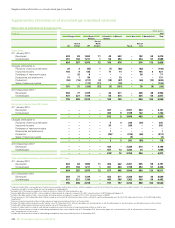
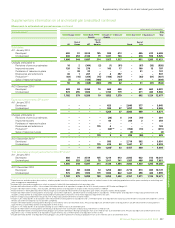
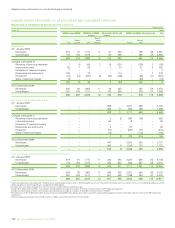
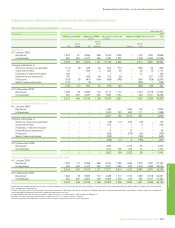
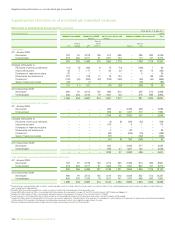
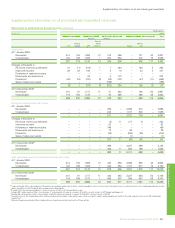
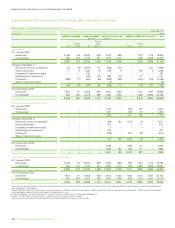
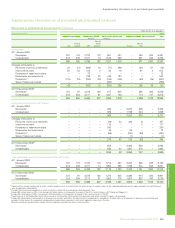
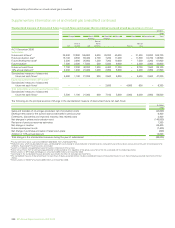
Standardized measure of discounted future net cash ows and changes therein relating to proved oil and gas reserves
Thefollowingtablessetoutthestandardizedmeasureofdiscountedfuturenetcashows,andchangestherein,relatingtocrudeoilandnaturalgas
productionfromthegroup’sestimatedprovedreserves.ThisinformationispreparedincompliancewithFASBOilandGasDisclosuresrequirements.
Futurenetcashowshavebeenpreparedonthebasisofcertainassumptionswhichmayormaynotberealized.Theseincludethetimingoffuture
production,theestimationofcrudeoilandnaturalgasreservesandtheapplicationofaveragecrudeoilandnaturalgaspricesandexchangeratesfromthe
previous12months.Furthermore,bothprovedreservesestimatesandproductionforecastsaresubjecttorevisionasfurthertechnicalinformation
becomesavailableandeconomicconditionschange.BPcautionsagainstrelyingontheinformationpresentedbecauseofthehighlyarbitrarynatureofthe
assumptionsonwhichitisbasedanditslackofcomparabilitywiththehistoricalcostinformationpresentedinthenancialstatements.
$million
2010
Europe North South Africa Asia Australasia Total
America America
Rest of
Rest of North Rest of
UK Europe US America Russia Asia
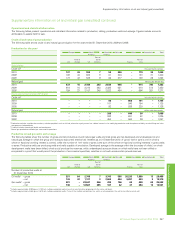
At31December2010
Subsidiaries
Futurecashinowsa73,100 25,800 264,800 200 29,300 70,800 – 52,500 42,300 558,800
Futureproductioncostb25,700 9,800 111,400 200 6,800 14,000 – 13,400 12,800 194,100
Futuredevelopmentcostb7,400 2,500 24,300 – 6,100 14,600 – 9,900 3,100 67,900
Futuretaxationc19,900 8,100 41,900 – 8,200 14,100 – 7,000 6,200 105,400
Futurenetcashows 20,100 5,400 87,200 – 8,200 28,100 – 22,200 20,200 191,400
10%annualdiscountd9,800 2,300 45,500 – 3,300 11,900 – 8,200 10,300 91,300
Standardizedmeasureofdiscounted
futurenetcashowse10,300 3,100 41,700 – 4,900 16,200 – 14,000 9,900 100,100
Equity-accountedentities(BPshare)f
Futurecashinowsa– – – 9,700 45,500 – 110,500 31,000 – 196,700
Futureproductioncostb– – – 4,500 19,200 – 80,900 26,500 – 131,100
Futuredevelopmentcostb– – – 2,000 4,300 – 11,000 2,800 – 20,100
Futuretaxationc– – – 800 7,500 – 3,900 200 – 12,400
Futurenetcashows – – – 2,400 14,500 – 14,700 1,500 – 33,100
10%annualdiscountd– – – 2,400 8,700 – 6,100 700 – 17,900
Standardizedmeasureofdiscounted
netcashowsgh
future – – – – 5,800 – 8,600 800 – 15,200
Totalsubsidiariesandequity-accountedentities
Standardizedmeasureofdiscounted
futurenetcashowsj10,300 3,100 41,700 – 10,700 16,200 8,600 14,800 9,900 115,300
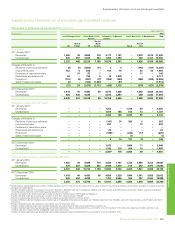
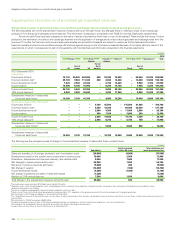
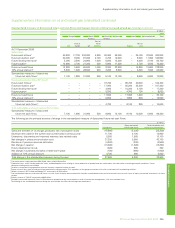
Thefollowingaretheprincipalsourcesofchangeinthestandardizedmeasureofdiscountedfuturenetcashows:
$million
Equity-accounted Total subsidiaries and
Subsidiaries entities (BP share) equity-accounted entities
Salesandtransfersofoilandgasproduced,netofproductioncosts (26,600) (4,900) (31,500)
Developmentcostsforthecurrentyearasestimatedinpreviousyear 10,400 2,000 12,400
Extensions,discoveriesandimprovedrecovery,lessrelatedcosts 9,600 1,600 11,200
Netchangesinpricesandproductioncost 52,800 1,900 54,700
Revisionsofpreviousreservesestimates (9,200) 200 (9,000)
Netchangeintaxation (13,400) (300) (13,700)
Futuredevelopmentcosts (4,300) (1,400) (5,700)
Netchangeinpurchaseandsalesofreserves-in-place (1,500) – (1,500)
Additionof10%annualdiscount 7,500 1,500 9,000
Totalchangeinthestandardizedmeasureduringtheyeari 25,300 600 25,900
a T
hemarkerpricesusedwereBrent$79.02/bbl,HenryHub$4.37/mmBtu.
b
Productioncosts,whichincludeproductiontaxes,anddevelopmentcostsrelatingtofutureproductionofprovedreservesarebasedonthecontinuationofexistingeconomicconditions.Future
decommissioningcostsareincluded.
c T
axationiscomputedusingappropriateyear-endstatutorycorporateincometaxrates.
d
Futurenetcashowsfromoilandnaturalgasproductionarediscountedat10%regardlessofthegroupassessmentoftheriskassociatedwithitsproducingactivities.
e
MinorityinterestinBPTrinidadandTobagoLLCamountedto$1,200million.
fT
hestandardizedmeasureofdiscountedfuturenetcashowsofequity-accountedentitiesincludesstandardizedmeasureofdiscountedfuturenetcashowsofequity-accountedinvestmentsof
thoseentities.
g
MinorityinterestinTNK-BPamountedto$600million.
h
Noequity-accountedfuturecashowsinAfricabecauseprovedreservesarereceivedasaresultofcontractualarrangements,withnoassociatedcosts.
iT
otalchangeinthestandardizedmeasureduringtheyearincludestheeffectofexchangeratemovements.
jIncludesfuturenetcashowsforassetsheldforsaleat31December2010.
244BPAnnualReportandForm20-F2010