BP 2010 Annual Report Download - page 167
Download and view the complete annual report
Please find page 167 of the 2010 BP annual report below. You can navigate through the pages in the report by either clicking on the pages listed below, or by using the keyword search tool below to find specific information within the annual report.-
 1
1 -
2
-
3
-
4
-
5
-
6
-
7
-
8
-
9
-
10
-
11
-
12
-
13
-
14
-
15
-
16
-
17
-
18
-
19
-
20
-
21
-
22
-
23
-
24
-
25
-
26
-
27
-
28
-
29
-
30
-
31
-
32
-
33
-
34
-
35
-
36
-
37
-
38
-
39
-
40
-
41
-
42
-
43
-
44
-
45
-
46
-
47
-
48
-
49
-
50
-
51
-
52
-
53
-
54
-
55
-
56
-
57
-
58
-
59
-
60
-
61
-
62
-
63
-
64
-
65
-
66
-
67
-
68
-
69
-
70
-
71
-
72
-
73
-
74
-
75
-
76
-
77
-
78
-
79
-
80
-
81
-
82
-
83
-
84
-
85
-
86
-
87
-
88
-
89
-
90
-
91
-
92
-
93
-
94
-
95
-
96
-
97
-
98
-
99
-
100
-
101
-
102
-
103
-
104
-
105
-
106
-
107
-
108
-
109
-
110
-
111
-
112
-
113
-
114
-
115
-
116
-
117
-
118
-
119
-
120
-
121
-
122
-
123
-
124
-
125
-
126
-
127
-
128
-
129
-
130
-
131
-
132
-
133
-
134
-
135
-
136
-
137
-
138
-
139
-
140
-
141
-
142
-
143
-
144
-
145
-
146
-
147
-
148
-
149
-
150
-
151
-
152
-
153
-
154
-
155
-
156
-
 157
157 -
 158
158 -
 159
159 -
 160
160 -
 161
161 -
 162
162 -
 163
163 -
 164
164 -
 165
165 -
 166
166 -
 167
167 -
 168
168 -
 169
169 -
 170
170 -
 171
171 -
 172
172 -
 173
173 -
 174
174 -
 175
175 -
 176
176 -
 177
177 -
178
-
179
-
180
-
181
-
182
-
183
-
184
-
185
-
186
-
187
-
188
-
189
-
190
-
191
-
192
-
193
-
194
-
195
-
196
-
197
-
198
-
199
-
200
-
201
-
202
-
203
-
204
-
205
-
206
-
207
-
208
-
209
-
210
-
211
-
212
-
213
-
214
-
215
-
216
-
217
-
218
-
219
-
220
-
221
-
222
-
223
-
224
-
225
-
226
-
227
-
228
-
229
-
230
-
231
-
232
-
233
-
234
-
235
-
236
-
237
-
238
-
239
-
240
-
241
-
242
-
243
-
244
-
245
-
246
-
247
-
248
-
249
-
250
-
251
-
252
-
253
-
254
-
255
-
256
-
257
-
258
-
259
-
260
-
261
-
262
-
263
-
264
-
265
-
266
-
267
-
268
-
269
-
270
-
271
-
272
 |
 |

Notesonnancialstatements
Financial statements
5.Disposalsandimpairmentcontinued
ReningandMarketing
In2010,gainsresultedfromourdisposalsoftheFrenchretailfuelsandconveniencebusinesstoDelekEurope,thefuelsmarketingbusinessinBotswana
toPumaEnergy,certainnon-strategicpipelinesandterminalsintheUS,ourinterestsinethyleneandpolyethyleneproductioninMalaysiatoPetronasand
ourinterestinafuturesexchange.Lossesresultedfromthedisposalofanumberofassetsinthesegmentportfolio.
In2009,gainsondisposalmainlyresultedfromthedisposalofourgroundfuelsmarketingbusinessinGreeceandretailchurnintheUS,Europe
andAustralasia.Lossesresultedfromthecontinueddisposalofcompany-ownedandcompany-operatedretailsitesintheUS,retailchurnanddisposalsof
assetselsewhereinthesegmentportfolio.Retailchurnistheoverallprocessofacquiringanddisposingofretailsitesbywhichthegroupaimstoimprove
thequalityandmixofitsportfolioofservicestations.
In2008,themajortransactionsresultingingainswerethecontributionofourToledorenerytoaUSjointlycontrolledentityinanexchange
transactionwithHuskyEnergyandthedisposalsofourinterestintheDixiePipelineandcertainretailassetsintheUS.Thelossesonsalerelatedmainly
tothedisposalofretailassetsintheUSandEurope.Inaddition,certainassetsatourAcetylsplantinHull,UK,andotherinterestsintheUKandEurope
weresold.
Otherbusinessesandcorporate
In2010,wedisposedofour35%interestinK-Power,agas-redpowerassetinSouthKorea,andcontributedourCedarCreek2windenergydevelopment
assetinexchangefora50%equityinterestinajointlycontrolledentity,CedarCreekIIHoldingsLLC(CedarCreek2)andcash.Inaddition,therewasa
returnofcapitalinthejointlycontrolledentitiesFowlerIIHoldingsLLCandCedarCreekIIHoldingsLLCwhichdidnotchangeourpercentageinterestin
eitherentity.
During2009,wedisposedofourwindenergybusinessinIndiaandcontributedourFowler2windenergydevelopmentassetinexchangefora
50%equityinterestinajointlycontrolledentity,FowlerIIHoldingsLLC.Inaddition,therewasareturnofcapitalinthejointlycontrolledentityFowlerRidge
WindFarmLLCwhichdidnotchangeourpercentageinterestintheentity.
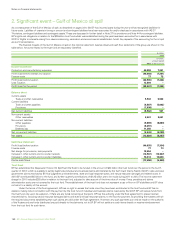
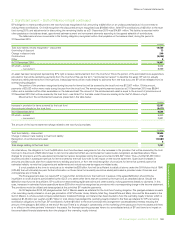
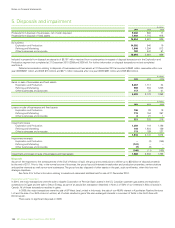
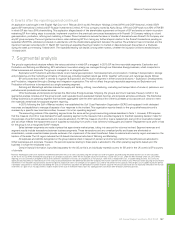
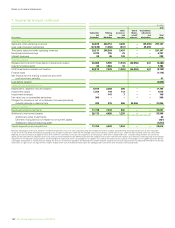
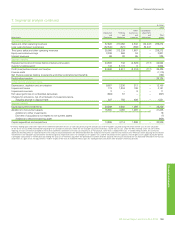
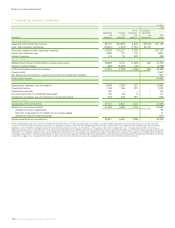
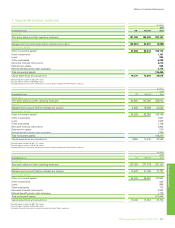
Summarizednancialinformationrelatingtothesaleofbusinessesisshowninthetablebelow.Informationrelatingtosalesofxedassetsisexcluded
fromthetable.
$million
2010 2009 2008
Non-currentassets 2,319 536 759
Currentassets 310 444 485
Non-currentliabilities (303) (146) –
Currentliabilities (124) (152) (134)
Totalcarryingamountofnetassetsdisposed 2,202 682 1,110
Recyclingofforeignexchangeondisposal (52) (27) –
Costsondisposal 18 3 7
2,168 658 1,117
Protonsaleofbusinessesa 1,968 314 1,721
Totalconsideration 4,136 972 2,838
Fairvalueofinterestreceivedinajointlycontrolledentity – – (2,838)
Considerationreceived(receivable)b 20 (6) 11
Proceedsfromthesaleofbusinessesrelatedtocompletedtransactions 4,156 966 11
Depositsreceivedrelatedtoassetsclassiedasheldforsale 5,306 – –
Proceedsfromthesaleofbusinessesc 9,462 966 11
a
Ofwhich$929milliongainwasnotrecognizedintheincomestatementin2008asitrepresentedanunrealizedgainonthetransferoftheToledoreneryintoajointlycontrolledentity.
b
Considerationreceivedfromprioryearbusinessdisposalsornotyetreceivedfromcurrentyeardisposals.
c
Netofcashandcashequivalentsdisposedof$55million(2009$91millionand2008nil).
Impairment
Inassessingwhetherawrite-downisrequiredinthecarryingvalueofapotentiallyimpairedintangibleasset,itemofproperty,plantandequipmentoran
equity-accountedinvestment,theasset’scarryingvalueiscomparedwithitsrecoverableamount.Therecoverableamountisthehigheroftheasset’sfair
valuelesscoststosellandvalueinuse.Unlessindicatedotherwise,therecoverableamountusedinassessingtheimpairmentchargesdescribedbelowis
valueinuse.Thegroupestimatesvalueinuseusingadiscountedcashowmodel.Thefuturecashowsareadjustedforrisksspecictotheassetand
arediscountedusingapre-taxdiscountrate.Thisdiscountrateisderivedfromthegroup’spost-taxweightedaveragecostofcapitalandisadjustedwhere
applicabletotakeintoaccountanyspecicrisksrelatingtothecountrywherethecash-generatingunitislocated,althoughotherratesmaybeusedif
appropriatetothespeciccircumstances.In2010theratesusedrangedfrom11-14%(20099-13%).Therateappliedineachcountryisre-assessedeach
year.Incertaincircumstancesanimpairmentassessmentmaybecarriedoutusingfairvaluelesscoststosellastherecoverableamountwhen,for
example,arecentmarkettransactionforasimilarassethastakenplace.Forimpairmentsofavailable-for-salenancialassetsthatarequotedinvestments,
thefairvalueisdeterminedbyreferencetobidpricesatthecloseofbusinessatthebalancesheetdate.Anycumulativelosspreviouslyrecognizedinother
comprehensiveincomeistransferredtotheincomestatement.
BPAnnualReportandForm20-F2010 165