BP 2010 Annual Report Download - page 226
Download and view the complete annual report
Please find page 226 of the 2010 BP annual report below. You can navigate through the pages in the report by either clicking on the pages listed below, or by using the keyword search tool below to find specific information within the annual report.-
 1
1 -
2
-
3
-
4
-
5
-
6
-
7
-
8
-
9
-
10
-
11
-
12
-
13
-
14
-
15
-
16
-
17
-
18
-
19
-
20
-
21
-
22
-
23
-
24
-
25
-
26
-
27
-
28
-
29
-
30
-
31
-
32
-
33
-
34
-
35
-
36
-
37
-
38
-
39
-
40
-
41
-
42
-
43
-
44
-
45
-
46
-
47
-
48
-
49
-
50
-
51
-
52
-
53
-
54
-
55
-
56
-
57
-
58
-
59
-
60
-
61
-
62
-
63
-
64
-
65
-
66
-
67
-
68
-
69
-
70
-
71
-
72
-
73
-
74
-
75
-
76
-
77
-
78
-
79
-
80
-
81
-
82
-
83
-
84
-
85
-
86
-
87
-
88
-
89
-
90
-
91
-
92
-
93
-
94
-
95
-
96
-
97
-
98
-
99
-
100
-
101
-
102
-
103
-
104
-
105
-
106
-
107
-
108
-
109
-
110
-
111
-
112
-
113
-
114
-
115
-
116
-
117
-
118
-
119
-
120
-
121
-
122
-
123
-
124
-
125
-
126
-
127
-
128
-
129
-
130
-
131
-
132
-
133
-
134
-
135
-
136
-
137
-
138
-
139
-
140
-
141
-
142
-
143
-
144
-
145
-
146
-
147
-
148
-
149
-
150
-
151
-
152
-
153
-
154
-
155
-
156
-
157
-
158
-
159
-
160
-
161
-
162
-
163
-
164
-
165
-
166
-
167
-
168
-
169
-
170
-
171
-
172
-
173
-
174
-
175
-
176
-
177
-
178
-
179
-
180
-
181
-
182
-
183
-
184
-
185
-
186
-
187
-
188
-
189
-
190
-
191
-
192
-
193
-
194
-
195
-
196
-
197
-
198
-
199
-
200
-
201
-
202
-
203
-
204
-
205
-
206
-
207
-
208
-
209
-
210
-
211
-
212
-
213
-
214
-
215
-
 216
216 -
 217
217 -
 218
218 -
 219
219 -
 220
220 -
 221
221 -
 222
222 -
 223
223 -
 224
224 -
 225
225 -
 226
226 -
 227
227 -
 228
228 -
 229
229 -
 230
230 -
 231
231 -
 232
232 -
 233
233 -
 234
234 -
 235
235 -
 236
236 -
237
-
238
-
239
-
240
-
241
-
242
-
243
-
244
-
245
-
246
-
247
-
248
-
249
-
250
-
251
-
252
-
253
-
254
-
255
-
256
-
257
-
258
-
259
-
260
-
261
-
262
-
263
-
264
-
265
-
266
-
267
-
268
-
269
-
270
-
271
-
272
 |
 |

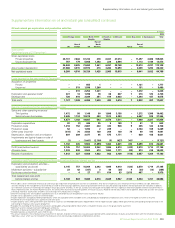
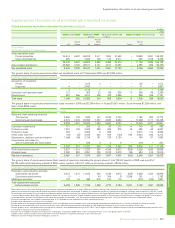
Notesonnancialstatements
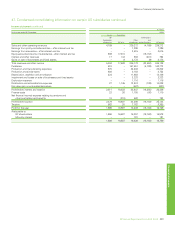
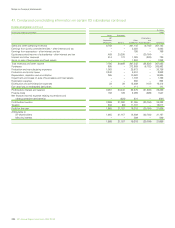
47.CondensedconsolidatinginformationoncertainUSsubsidiariescontinued
Income statement continued
$million
Fortheyearended31December 2008
Issuer Guarantor
BP Eliminations
Exploration Other and
(Alaska)Inc. BPp.l.c. subsidiaries reclassications BPgroup
Salesandotheroperatingrevenues 6,782 – 361,143 (6,782) 361,143
Earningsfromjointlycontrolledentities–afterinterestandtax – – 3,023 – 3,023
Earningsfromassociates–afterinterestandtax – – 798 – 798
Equity-accountedincomeofsubsidiaries–afterinterestandtax 469 20,295 – (20,764) –
Interestandotherrevenues 514 173 1,025 (976) 736
Gainsonsaleofbusinessesandxedassets – – 1,353 – 1,353
Totalrevenuesandotherincome 7,765 20,468 367,342 (28,522) 367,053
Purchases 895 – 272,869 (6,782) 266,982
Productionandmanufacturingexpenses 1,083 – 25,673 – 26,756
Productionandsimilartaxes 2,343 – 6,610 – 8,953
Depreciation,depletionandamortization 365 – 10,620 – 10,985
Impairmentandlossesonsaleofbusinessesandxedassets – – 1,733 – 1,733
Explorationexpense – – 882 – 882
Distributionandadministrationexpenses 22 28 15,469 (107) 15,412
Fairvaluelossonembeddedderivatives – – 111 – 111
Protbeforeinterestandtaxation 3,057 20,440 33,375 (21,633) 35,239
Financecosts 158 169 2,089 (869) 1,547
Netnance(income)expenserelatingtopensionsand
otherpost-retirementbenets – (822) 231 – (591)
Protbeforetaxation 2,899 21,093 31,055 (20,764) 34,283
Taxation 944 (64) 11,737 – 12,617
Protfortheyear 1,955 21,157 19,318 (20,764) 21,666
Attributableto
BPshareholders 1,955 21,157 18,809 (20,764) 21,157
Minorityinterest – – 509 – 509
1,955 21,157 19,318 (20,764) 21,666
224BPAnnualReportandForm20-F2010