BP 2010 Annual Report Download - page 250
Download and view the complete annual report
Please find page 250 of the 2010 BP annual report below. You can navigate through the pages in the report by either clicking on the pages listed below, or by using the keyword search tool below to find specific information within the annual report.-
 1
1 -
2
-
3
-
4
-
5
-
6
-
7
-
8
-
9
-
10
-
11
-
12
-
13
-
14
-
15
-
16
-
17
-
18
-
19
-
20
-
21
-
22
-
23
-
24
-
25
-
26
-
27
-
28
-
29
-
30
-
31
-
32
-
33
-
34
-
35
-
36
-
37
-
38
-
39
-
40
-
41
-
42
-
43
-
44
-
45
-
46
-
47
-
48
-
49
-
50
-
51
-
52
-
53
-
54
-
55
-
56
-
57
-
58
-
59
-
60
-
61
-
62
-
63
-
64
-
65
-
66
-
67
-
68
-
69
-
70
-
71
-
72
-
73
-
74
-
75
-
76
-
77
-
78
-
79
-
80
-
81
-
82
-
83
-
84
-
85
-
86
-
87
-
88
-
89
-
90
-
91
-
92
-
93
-
94
-
95
-
96
-
97
-
98
-
99
-
100
-
101
-
102
-
103
-
104
-
105
-
106
-
107
-
108
-
109
-
110
-
111
-
112
-
113
-
114
-
115
-
116
-
117
-
118
-
119
-
120
-
121
-
122
-
123
-
124
-
125
-
126
-
127
-
128
-
129
-
130
-
131
-
132
-
133
-
134
-
135
-
136
-
137
-
138
-
139
-
140
-
141
-
142
-
143
-
144
-
145
-
146
-
147
-
148
-
149
-
150
-
151
-
152
-
153
-
154
-
155
-
156
-
157
-
158
-
159
-
160
-
161
-
162
-
163
-
164
-
165
-
166
-
167
-
168
-
169
-
170
-
171
-
172
-
173
-
174
-
175
-
176
-
177
-
178
-
179
-
180
-
181
-
182
-
183
-
184
-
185
-
186
-
187
-
188
-
189
-
190
-
191
-
192
-
193
-
194
-
195
-
196
-
197
-
198
-
199
-
200
-
201
-
202
-
203
-
204
-
205
-
206
-
207
-
208
-
209
-
210
-
211
-
212
-
213
-
214
-
215
-
216
-
217
-
218
-
219
-
220
-
221
-
222
-
223
-
224
-
225
-
226
-
227
-
228
-
229
-
230
-
231
-
232
-
233
-
234
-
235
-
236
-
237
-
238
-
239
-
 240
240 -
 241
241 -
 242
242 -
 243
243 -
 244
244 -
 245
245 -
 246
246 -
 247
247 -
 248
248 -
 249
249 -
 250
250 -
 251
251 -
 252
252 -
 253
253 -
 254
254 -
 255
255 -
 256
256 -
 257
257 -
 258
258 -
 259
259 -
 260
260 -
261
-
262
-
263
-
264
-
265
-
266
-
267
-
268
-
269
-
270
-
271
-
272
 |
 |

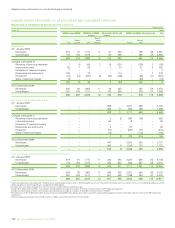
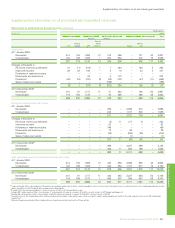
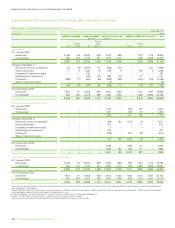
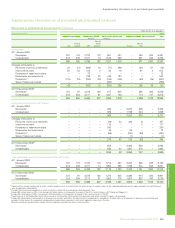
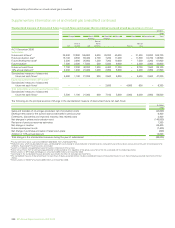
Supplementaryinformationonoilandnaturalgas(unaudited)
Supplementaryinformationonoilandnaturalgas(unaudited)continued
Europe North South Africa Asia Australasia Total
America America
Restof
Restof North Restof
UK Europe US America Russia Asia
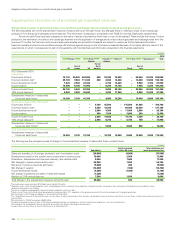
Oilandnaturalgasacreageat31December2010 Thousandsofacres
Developed –gross 346 65 6,920 198 1,738 497 2,282 2,434 162 14,642
–net 189 21 4,184 157 471 195 885 935 35 7,072
Undevelopeda –gross 1,311 186 6,970 7,185 12,434 21,373 32,137 18,366 7,330 107,292
–net 775 79 4,663 4,380 6,398 16,072 15,475 8,955 2,796 59,593
a
Undevelopedacreageincludesleasesandconcessions.
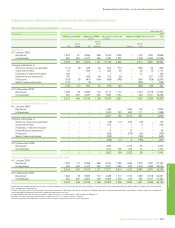
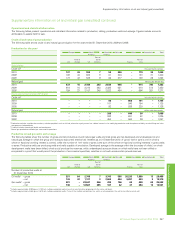
Net oil and gas wells completed or abandoned
Thefollowingtableshowsthenumberofnetproductiveanddryexploratoryanddevelopmentoilandnaturalgaswellscompletedorabandonedinthe
yearsindicatedbythegroupanditsequity-accountedentities.Productivewellsincludewellsinwhichhydrocarbonswereencounteredandthedrillingor
completionofwhich,inthecaseofexploratorywells,hasbeensuspendedpendingfurtherdrillingorevaluation.Adrywellisonefoundtobeincapableof
producinghydrocarbonsinsufcientquantitiestojustifycompletion.
Europe North South Africa Asia Australasia Total
America America
Restof
Restof North Restof
UK Europe US America Russia Asia
2010
Exploratory
Productive – 0.2 39.3 – 1.3 1.2 10.5 2.8 0.3 55.6
Dry 0.7 – 0.3 – 0.9 1.4 4.0 – – 7.3
Development
Productive 6.4 1.2 260.0 31.7 105.7 18.9 364.3 53.3 – 841.5
Dry 1.7 – 0.5 – 1.2 2.7 – 2.4 – 8.5
2009
Exploratory
Productive 0.1 – 47.2 – 3.0 4.5 7.0 5.3 0.6 67.7
Dry 0.2 – 4.2 – – 1.4 4.5 6.0 0.2 16.5
Development
Productive 9.3 1.5 403.8 17.9 135.4 20.8 293.0 45.8 1.6 929.1
Dry – – 3.3 – – 0.5 4.0 0.4 0.6 8.8
2008
Exploratory
Productive 0.8 – 2.4 – 4.4 4.3 12.5 0.5 0.6 25.5
Dry – 0.5 0.9 0.1 0.4 2.6 23.0 0.5 0.4 28.4
Development
Productive 6.6 0.5 379.8 28.3 112.5 18.6 10.0 45.4 4.5 606.2
Dry 0.2 – 1.1 0.9 2.9 1.5 19.5 2.1 – 28.2
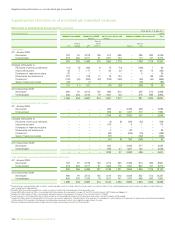
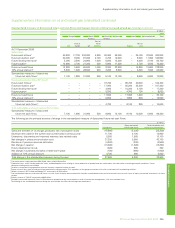
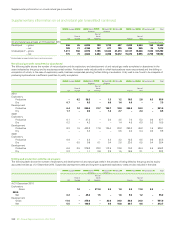
Drilling and production activities in progress
Thefollowingtableshowsthenumberofexploratoryanddevelopmentoilandnaturalgaswellsintheprocessofbeingdrilledbythegroupanditsequity-
accountedentitiesasof31December2010.Suspendeddevelopmentwellsandlong-termsuspendedexploratorywellsarealsoincludedinthetable.
Europe North South Africa Asia Australasia Total
America America
Restof
Restof North Restof
UK Europe US America Russia Asia
At31December2010
Exploratory
Gross 1.0 – 211.0 3.0 1.0 3.0 11.0 3.0 –
233.0
Net 0.2 – 45.2 1.5 – 1.6 5.5 1.2 – 55.2
Development
Gross 11.0 – 375.0 – 23.0 34.0 88.0 20.0 – 551.0
Net 5.5 – 140.6 – 9.5 10.8 39.7 6.6 – 212.7
248BPAnnualReportandForm20-F2010