Assurant 2012 Annual Report Download - page 6
Download and view the complete annual report
Please find page 6 of the 2012 Assurant annual report below. You can navigate through the pages in the report by either clicking on the pages listed below, or by using the keyword search tool below to find specific information within the annual report.-
 1
1 -
 2
2 -
 3
3 -
 4
4 -
 5
5 -
 6
6 -
 7
7 -
 8
8 -
 9
9 -
 10
10 -
 11
11 -
 12
12 -
 13
13 -
 14
14 -
 15
15 -
 16
16 -
 17
17 -
18
-
19
-
20
-
21
-
22
-
23
-
24
-
25
-
26
-
27
-
28
-
29
-
30
-
31
-
32
-
33
-
34
-
35
-
36
-
37
-
38
-
39
-
40
-
41
-
42
-
43
-
44
-
45
-
46
-
47
-
48
-
49
-
50
-
51
-
52
-
53
-
54
-
55
-
56
-
57
-
58
-
59
-
60
-
61
-
62
-
63
-
64
-
65
-
66
-
67
-
68
-
69
-
70
-
71
-
72
-
73
-
74
-
75
-
76
-
77
-
78
-
79
-
80
-
81
-
82
-
83
-
84
-
85
-
86
-
87
-
88
-
89
-
90
-
91
-
92
-
93
-
94
-
95
-
96
-
97
-
98
-
99
-
100
-
101
-
102
-
103
-
104
-
105
-
106
-
107
-
108
-
109
-
110
-
111
-
112
-
113
-
114
-
115
-
116
-
117
-
118
-
119
-
120
-
121
-
122
-
123
-
124
-
125
-
126
-
127
-
128
-
129
-
130
-
131
-
132
-
133
-
134
-
135
-
136
-
137
-
138
-
139
-
140
-
141
-
142
-
143
-
144
 |
 |

ASSURANT - 2012 Annual Report4
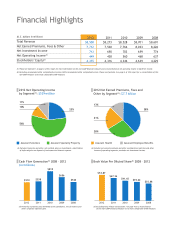
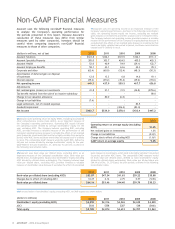
Non-GAAP Financial Measures
(dollars in millions, net of tax) 2012 2011 2010 2009 2008
Assurant Solutions $123.8 $136.1 $101.5 $122.1 $111.3
Assurant Specialty Property 305.0 303.7 424.5 405.5 403.3
Assurant Health 52.0 40.9 54.9 (29.1) 122.7
Assurant Employee Benefi ts 58.1 43.1 63.6 42.3 70.3
Corporate and other (62.4) (60.0) (52.4) (48.3) (50.3)
Amortization of deferred gain on disposal
of businesses 12.0 13.3 6.8 14.6 19.1
Interest expense (39.2) (39.2) (39.4) (39.4) (39.6)
Net operating income 449.3 437.9 559.5 467.7 636.8
Adjustments:
Net realized gains (losses) on investments 41.8 21.1 31.5 (34.8) (278.6)
Tax benefi t realized from the sale of an inactive subsidiary - - - - 89.0
Change in tax valuation allowance - 80.0 (6.0) - -
Change in tax liabilities (7.4)----
Legal settlement, net of related expenses - - - 83.5 -
Goodwill impairment - - (306.4) (83.0) -
Net income $483.7 $539.0 $278.6 $433.4 $447.2
Assurant uses the following non-GAAP fi nancial measures
to analyze the Company’s operating performance for
the periods presented in this report. Because Assurant’s
calculation of these measures may differ from similar
measures used by other companies, investors should be
careful when comparing Assurant’s non-GAAP fi nancial
measures to those of other companies.
(1) Assurant uses net operating income as an important measure of the
Company’s operating performance. As shown in the following reconciliation
table, net operating income equals net income, excluding net realized
gains (losses) on investments and other unusual and/or infrequent items.
The Company believes net operating income provides investors a valuable
measure of the performance of the Company’s ongoing business because it
excludes both the effect of net realized gains (losses) on investments that
tend to be highly variable from period to period, and those events that are
unusual and/or unlikely to recur.
(2) Assurant uses operating return on equity (ROE), excluding accumulated
other comprehensive income (loss) (AOCI), as an important measure of
the Company’s operating performance. Operating ROE equals full-year
net operating income divided by average stockholders’ equity for the
year, excluding AOCI. The Company believes operating ROE, excluding
AOCI, provides investors a valuable measure of the performance of the
Company’s ongoing business because it excludes the effect of net realized
gains (losses) on investments that tend to be highly variable from period to
period, other AOCI items and those events that are unusual and/or unlikely
to recur. The comparable GAAP measure would be GAAP ROE, defi ned as
full-year net income divided by average stockholders’ equity for the year.
GAAP ROE for the year ended Dec. 31, 2012 was 9.6 percent, as shown in
the following reconciliation table.
2012
Operating return on average equity (excluding
AOCI) 10.4%
Net realized gains on investments 1.0%
Change in tax liabilities (0.2)%
Change due to effect of including AOCI (1.6)%
GAAP return on average equity 9.6%
(3) Assurant uses book value per diluted share, excluding AOCI, as an
important measure of the Company’s stockholder value. Book value per
diluted share, excluding AOCI, equals total stockholders’ equity excluding
AOCI divided by diluted shares outstanding. The Company believes book
value per diluted share, excluding AOCI, provides investors a valuable
measure of stockholder value because it excludes the effect of unrealized
gains (losses) on investments, which tend to be highly variable from period
to period, and other AOCI items. The comparable GAAP measure would
be book value per diluted share, defi ned as total stockholders’ equity
divided by diluted shares outstanding. Book value per diluted share was
$64.14 as of Dec. 31, 2012 and, for prior periods, as shown in the following
reconciliation table.
2012
2011 2010 2009 2008
Book value per diluted share (excluding AOCI) $53.87 $47.34 $41.65 $39.22 $35.88
Changes due to effect of including AOCI 10.27 6.12 2.75 0.57 (5.65)
Book value per diluted share $64.14 $53.46 $44.40 $39.79 $30.23
(4) A reconciliation of stockholders’ equity, excluding AOCI, to GAAP equity is as shown below:
(dollars in millions)
2012
2011 2010 2009 2008
Stockholders’ equity (excluding AOCI) $4,355 $4,316 $4,346 $4,639 $4,229
AOCI $830 $558 $287 $68 ($666)
Total equity $5,185 $4,874 $4,633 $4,707 $3,563