Assurant 2012 Annual Report Download - page 2
Download and view the complete annual report
Please find page 2 of the 2012 Assurant annual report below. You can navigate through the pages in the report by either clicking on the pages listed below, or by using the keyword search tool below to find specific information within the annual report.-
 1
1 -
 2
2 -
 3
3 -
 4
4 -
 5
5 -
 6
6 -
 7
7 -
 8
8 -
 9
9 -
 10
10 -
 11
11 -
 12
12 -
 13
13 -
14
-
15
-
16
-
17
-
18
-
19
-
20
-
21
-
22
-
23
-
24
-
25
-
26
-
27
-
28
-
29
-
30
-
31
-
32
-
33
-
34
-
35
-
36
-
37
-
38
-
39
-
40
-
41
-
42
-
43
-
44
-
45
-
46
-
47
-
48
-
49
-
50
-
51
-
52
-
53
-
54
-
55
-
56
-
57
-
58
-
59
-
60
-
61
-
62
-
63
-
64
-
65
-
66
-
67
-
68
-
69
-
70
-
71
-
72
-
73
-
74
-
75
-
76
-
77
-
78
-
79
-
80
-
81
-
82
-
83
-
84
-
85
-
86
-
87
-
88
-
89
-
90
-
91
-
92
-
93
-
94
-
95
-
96
-
97
-
98
-
99
-
100
-
101
-
102
-
103
-
104
-
105
-
106
-
107
-
108
-
109
-
110
-
111
-
112
-
113
-
114
-
115
-
116
-
117
-
118
-
119
-
120
-
121
-
122
-
123
-
124
-
125
-
126
-
127
-
128
-
129
-
130
-
131
-
132
-
133
-
134
-
135
-
136
-
137
-
138
-
139
-
140
-
141
-
142
-
143
-
144
 |
 |

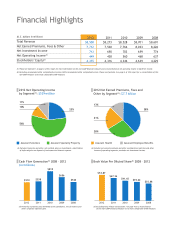
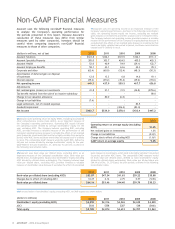
Financial Highlights
(U.S. dollars in millions) 2012 2011 2010 2009 2008
Total Revenue $8,508 $8,273 $8,528 $8,701 $8,601
Net Earned Premiums, Fees & Other 7,712 7,530 7,766 8,033 8,226
Net Investment Income 713 690 703 699 774
Net Operating Income(1) 449 438 560 468 637
Stock holders’ Equity(2) 4,355 4,316 4,346 4,639 4,229
(1) Please see footnote 1 on page 4 of this report for more information on this non-GAAP fi nancial measure and a reconciliation of net operating income to GAAP net income.
(2) Excluding accumulated other comprehensive income (AOCI)/accumulated other comprehensive loss. Please see footnote 4 on page 4 of this report for a reconciliation of this
non-GAAP measure to its most comparable GAAP measure.
Assurant Solutions Assurant Specialty Property Assurant Health Assurant Employee Benefits
20112012 2010 2009 2008
2012 Net Operating Income
by Segment(3): $539 million
2012 Net Earned Premiums, Fees and
Other by Segment(4): $7.7 billion
Book Value Per Diluted Share(6) 2008 – 2012Cash Flow Generation(5) 2008 – 2012
(in millions)
$47.34
$53.87
$41.65 $39.22 $35.88
20112012 2010 2009 2008
$538
$510
$819
$656
$520
(6) Excluding AOCI. Please see footnote 3 on page 4 for a reconciliation
of this non-GAAP financial measure to its most comparable GAAP measure.
(5) Primarily represents gross dividends from subsidiaries, net of interest and
other corporate expenses paid.
23%
56%
10%
11%
38%
28%
21%
13%
(3) Excludes Corporate and other, net realized gains on investments, amortization
of deferred gains on disposal of businesses and interest expense.
(4) Includes net earned premiums and other considerations and fees and other
income of operating segments; excludes net investment income.