Ameriprise 2014 Annual Report Download - page 13
Download and view the complete annual report
Please find page 13 of the 2014 Ameriprise annual report below. You can navigate through the pages in the report by either clicking on the pages listed below, or by using the keyword search tool below to find specific information within the annual report.-
 1
1 -
2
-
 3
3 -
 4
4 -
 5
5 -
 6
6 -
 7
7 -
 8
8 -
 9
9 -
 10
10 -
 11
11 -
 12
12 -
 13
13 -
 14
14 -
 15
15 -
 16
16 -
 17
17 -
 18
18 -
 19
19 -
 20
20 -
 21
21 -
 22
22 -
 23
23 -
24
-
25
-
26
-
27
-
28
-
29
-
30
-
31
-
32
-
33
-
34
-
35
-
36
-
37
-
38
-
39
-
40
-
41
-
42
-
43
-
44
-
45
-
46
-
47
-
48
-
49
-
50
-
51
-
52
-
53
-
54
-
55
-
56
-
57
-
58
-
59
-
60
-
61
-
62
-
63
-
64
-
65
-
66
-
67
-
68
-
69
-
70
-
71
-
72
-
73
-
74
-
75
-
76
-
77
-
78
-
79
-
80
-
81
-
82
-
83
-
84
-
85
-
86
-
87
-
88
-
89
-
90
-
91
-
92
-
93
-
94
-
95
-
96
-
97
-
98
-
99
-
100
-
101
-
102
-
103
-
104
-
105
-
106
-
107
-
108
-
109
-
110
-
111
-
112
-
113
-
114
-
115
-
116
-
117
-
118
-
119
-
120
-
121
-
122
-
123
-
124
-
125
-
126
-
127
-
128
-
129
-
130
-
131
-
132
-
133
-
134
-
135
-
136
-
137
-
138
-
139
-
140
-
141
-
142
-
143
-
144
-
145
-
146
-
147
-
148
-
149
-
150
-
151
-
152
-
153
-
154
-
155
-
156
-
157
-
158
-
159
-
160
-
161
-
162
-
163
-
164
-
165
-
166
-
167
-
168
-
169
-
170
-
171
-
172
-
173
-
174
-
175
-
176
-
177
-
178
-
179
-
180
-
181
-
182
-
183
-
184
-
185
-
186
-
187
-
188
-
189
-
190
-
191
-
192
-
193
-
194
-
195
-
196
-
197
-
198
-
199
-
200
-
201
-
202
-
203
-
204
-
205
-
206
-
207
-
208
-
209
-
210
-
211
-
212
-
213
-
214
 |
 |

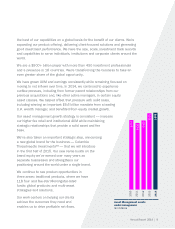
Dividends paid
Common stock share repurchases
2011
2012
2013
2010
2014 $1,372
$435
$1,481
$411
$1,340
$314
$1,456
$212
$573
$183
Dividends/share repurchases
$ in millions
equity and xed income mandates in the U.S., Europe and Asia. We’ve generated
several quarters of positive ows and have a solid new business pipeline.
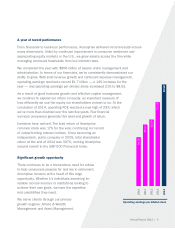
Financially, Asset Management delivered a record year. Operating net
revenues grew 5% to $3.3 billion, pretax operating earnings were up 14%
to $788 million and our adjusted net pretax operating margin was a
competitive 40%.
In Asset Management, we’re focused on our clients and are channeling
resources to the areas where we see the best growth opportunities.
We’re moving in a positive direction, and I feel good about the
opportunities before us.
Transforming our business mix and deploying capital
The effective execution of our growth strategy is transforming our
business mix and reinforcing our ability to deliver shareholder
value consistently.
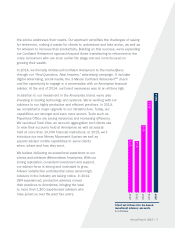
Advice & Wealth Management and Asset Management
generated 64% of 2014 pretax operating earnings, up
from 45% in 2010. The strong growth in these fee-
based, higher P/E businesses is complemented by the
strength, stability and differentiation of our Protection
and Annuity businesses.
Our nancial strength and capital position
differentiate Ameriprise. Our diversied model
generates signicant free cash ow. As we’ve
grown, we’ve prudently reduced overall capital
requirements — a combination that has
allowed us to continue to invest in the
business while returning capital to
shareholders at one of the highest rates
in nancial services.
Annual Report 2014 | 1110 | Annual Report 201410 | Annual Report 2014