Ameriprise 2010 Annual Report Download - page 2
Download and view the complete annual report
Please find page 2 of the 2010 Ameriprise annual report below. You can navigate through the pages in the report by either clicking on the pages listed below, or by using the keyword search tool below to find specific information within the annual report.-
 1
1 -
 2
2 -
 3
3 -
 4
4 -
 5
5 -
 6
6 -
 7
7 -
 8
8 -
 9
9 -
 10
10 -
 11
11 -
 12
12 -
 13
13 -
14
-
15
-
16
-
17
-
18
-
19
-
20
-
21
-
22
-
23
-
24
-
25
-
26
-
27
-
28
-
29
-
30
-
31
-
32
-
33
-
34
-
35
-
36
-
37
-
38
-
39
-
40
-
41
-
42
-
43
-
44
-
45
-
46
-
47
-
48
-
49
-
50
-
51
-
52
-
53
-
54
-
55
-
56
-
57
-
58
-
59
-
60
-
61
-
62
-
63
-
64
-
65
-
66
-
67
-
68
-
69
-
70
-
71
-
72
-
73
-
74
-
75
-
76
-
77
-
78
-
79
-
80
-
81
-
82
-
83
-
84
-
85
-
86
-
87
-
88
-
89
-
90
-
91
-
92
-
93
-
94
-
95
-
96
-
97
-
98
-
99
-
100
-
101
-
102
-
103
-
104
-
105
-
106
-
107
-
108
-
109
-
110
-
111
-
112
-
113
-
114
-
115
-
116
-
117
-
118
-
119
-
120
-
121
-
122
-
123
-
124
-
125
-
126
-
127
-
128
-
129
-
130
-
131
-
132
-
133
-
134
-
135
-
136
-
137
-
138
-
139
-
140
-
141
-
142
-
143
-
144
-
145
-
146
-
147
-
148
-
149
-
150
-
151
-
152
-
153
-
154
-
155
-
156
-
157
-
158
-
159
-
160
-
161
-
162
-
163
-
164
-
165
-
166
-
167
-
168
-
169
-
170
-
171
-
172
-
173
-
174
-
175
-
176
-
177
-
178
-
179
-
180
-
181
-
182
-
183
-
184
-
185
-
186
-
187
-
188
-
189
-
190
-
191
-
192
-
193
-
194
-
195
-
196
 |
 |

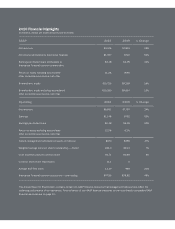
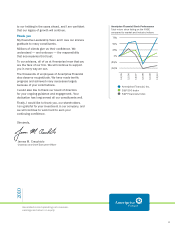
This Annual Report to Shareholders contains certain non-GAAP nancial measures that management believes best reect the
underlying performance of our operations. Reconciliations of non-GAAP nancial measures to the most directly comparable GAAP
nancial measures are on page 10.
2010 Financial Highlights
(in millions, except per share amounts and as noted)
GAAP 2010 2009 % Change
Net revenues $9,976 $7,805 28%
Net income attributable to Ameriprise Financial $1,097 $722 52%
Earnings per diluted share attributable to
Ameriprise Financial common shareholders
$4.18 $2.95 42%
Return on equity excluding accumulated
other comprehensive income, net of tax
11.2% 8.8%
Shareholders’ equity $10,725 $9,269 16%
Shareholders’ equity excluding accumulated
other comprehensive income, net of tax
$10,160 $9,004 13%
Operating 2010 2009 % Change
Net revenues $9,581 $7,730 24%
Earnings $1,148 $752 53%
Earnings per diluted share $4.38 $3.08 42%
Return on equity excluding accumulated
other comprehensive income, net of tax
12.3% 9.2%
Owned, managed and administered assets (in billions) $673 $458 47%
Weighted average common shares outstanding — diluted 262.3 244.4 7%
Cash dividends paid per common share $0.71 $0.68 4%
Common stock share repurchases 13.1 0
Average S&P 500 Index 1,139 948 20%
Ameriprise Financial common stock price — year ending $57.55 $38.82 48%