Ameriprise 2010 Annual Report Download - page 12
Download and view the complete annual report
Please find page 12 of the 2010 Ameriprise annual report below. You can navigate through the pages in the report by either clicking on the pages listed below, or by using the keyword search tool below to find specific information within the annual report.-
 1
1 -
 2
2 -
 3
3 -
 4
4 -
 5
5 -
 6
6 -
 7
7 -
 8
8 -
 9
9 -
 10
10 -
 11
11 -
 12
12 -
 13
13 -
 14
14 -
 15
15 -
 16
16 -
 17
17 -
 18
18 -
 19
19 -
 20
20 -
 21
21 -
 22
22 -
23
-
24
-
25
-
26
-
27
-
28
-
29
-
30
-
31
-
32
-
33
-
34
-
35
-
36
-
37
-
38
-
39
-
40
-
41
-
42
-
43
-
44
-
45
-
46
-
47
-
48
-
49
-
50
-
51
-
52
-
53
-
54
-
55
-
56
-
57
-
58
-
59
-
60
-
61
-
62
-
63
-
64
-
65
-
66
-
67
-
68
-
69
-
70
-
71
-
72
-
73
-
74
-
75
-
76
-
77
-
78
-
79
-
80
-
81
-
82
-
83
-
84
-
85
-
86
-
87
-
88
-
89
-
90
-
91
-
92
-
93
-
94
-
95
-
96
-
97
-
98
-
99
-
100
-
101
-
102
-
103
-
104
-
105
-
106
-
107
-
108
-
109
-
110
-
111
-
112
-
113
-
114
-
115
-
116
-
117
-
118
-
119
-
120
-
121
-
122
-
123
-
124
-
125
-
126
-
127
-
128
-
129
-
130
-
131
-
132
-
133
-
134
-
135
-
136
-
137
-
138
-
139
-
140
-
141
-
142
-
143
-
144
-
145
-
146
-
147
-
148
-
149
-
150
-
151
-
152
-
153
-
154
-
155
-
156
-
157
-
158
-
159
-
160
-
161
-
162
-
163
-
164
-
165
-
166
-
167
-
168
-
169
-
170
-
171
-
172
-
173
-
174
-
175
-
176
-
177
-
178
-
179
-
180
-
181
-
182
-
183
-
184
-
185
-
186
-
187
-
188
-
189
-
190
-
191
-
192
-
193
-
194
-
195
-
196
 |
 |

10
This report is not a solicitation for any of the products or
services mentioned. Investment products, including shares
of mutual funds, are not FDIC or otherwise federally insured,
are not deposits or obligations, or guaranteed by any nancial
institution, and involve investment risks, including possible loss
of principal and uctuation in value.
Actual results may vary materially from our plans, estimates
and beliefs. Please review carefully the discussion captioned
“Forward-Looking Statements” contained in Part II, Item 7 on
our Annual Report on Form 10-K for the year ended Dec. 31,
2010.
Rankings Sources: No. 1 nancial planning rm in the U.S.:
Ameriprise helped pioneer the nancial planning process more
than 30 years ago. We have more nancial planning clients and
more CERTIFIED FINANCIAL PLANNERTM professionals than any
other company based on data led at advisorinfo.sec.gov
and documented by the CFP Board of Standards, Inc., as
of Dec. 31, 2010. No. 2 mutual fund advisory program in
assets: Cerulli Edge - U.S. Managed Accounts 4Q 2010
edition, data as of 3Q 2010. No. 5 branded advisor force in
the U.S.: Company reports as of Dec. 31, 2010. No. 6 variable
universal life insurance provider (total assets): Towers Watson,
VALUETM Variable Life Survey, as of 4Q 2010. No. 7 long-term
mutual fund assets in the U.S.: ICI Complex Assets through
Dec. 31, 2010. No. 9 variable annuity provider (total assets):
Morningstar Annuity Research Center, Variable Annuity Sales
and Asset Survey, 3Q 2010.
Ameriprise Financial Services, Inc. offers nancial advisory
services, investments, insurance and annuity products.
Columbia Funds are distributed by Columbia Management
Investment Distributors, Inc., member FINRA, and managed
by Columbia Managment Investment Advisers, LLC. Seligman
is an offering brand of Columbia Management Investment
Advisers, LLC.
RiverSource insurance and annuity products are issued by
RiverSource Life Insurance Company and, in New York, by
RiverSource Life Insurance Co. of New York, Albany, NY, and
distributed by RiverSource Distributors, Inc.
Ameriprise Auto & Home Insurance issues auto, home and
umbrella insurance underwritten by IDS Property Casualty
Insurance Company or, in some states, Ameriprise Insurance
Company (AIC), DePere, WI.
The Threadneedle group of companies constitutes the
Ameriprise Financial international investment platform. The
group consists of wholly owned subsidiaries of Ameriprise
Financial, Inc. and provides services independent from
Ameriprise Financial Services, Inc., including Ameriprise
Financial Services’ broker-dealer business.
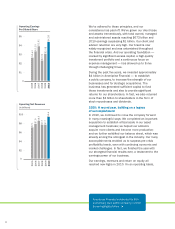
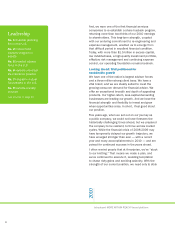
Since becoming an independent public company in 2005, we
have strived to deliver effective shareholder communications
while continuing to reduce the related expense and
environmental impact. Starting with the 2008 proxy season,
Ameriprise Financial was one of the first large companies to
implement the Notice & Access program for the distribution of
proxy materials, which significantly reduced the total number of
annual reports and proxy statements we print. We have continued
to reduce this annual expense: We expect to reduce the cost
of our 2010 Annual Report to Shareholders by more than 80%
compared to 2005.
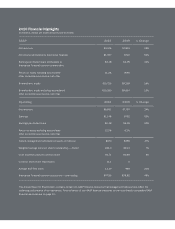
Disclosures (in millions) 2005 2006 2007 2008 2009 2010
Reported Net
Income (Loss) $574 $631 $814 $(36) $722 $1,097
Realized Net
(Gains) Losses,
after-tax(1)
(43) (33) (29) 506 (34) (22)
Integration,
Separation and
Restructuring
Charges, AMEX
Assurance and
Discontinued
Operations after-
tax(1)
119 235 154 51 64 73
Operating
Earnings $650 $833 $939 $521 $752 $1,148
(1) After-tax is calculated using the statutory tax rate of 35%.
(in dollars) 2005 2006 2007 2008 2009 2010
GAAP Earnings
per Diluted Share $2.32 $2.54 $3.39 $(.16) $2.95 $4.18
Operating
Adjustments 0.31 0.81 0.52 2.48 0.13 0.20
Operating
Earnings Per
Diluted Share
$2.63 $3.35 $3.91 $2.32 $3.08 $4.38
(in millions) 2005 2006 2007 2008 2009 2010
Reported Net
Revenues $7,341 $7,985 $8,506 $6,918 $7,805 $9,976
CIE Impact — (75) 3 49 (22) (362)
Realized Net
(Gains) Losses (67) (51) (44) 777 (53) (33)
AMEX Assurance (138) — — — — —
Operating Net
Revenues $7,136 $7,859 $8,465 $7,744 $7,730 $9,581
(in millions) 2005 2006 2007 2008 2009 2010
Return (net
income (loss)
for the last 12
months)
$574 $631 $814 $(36) $722 $1,097
Equity excluding
AOCI(1) $7,022 $7,927 $7,988 $7,722 $8,208 $9,769
Return on equity
excluding AOCI 8.2% 8.0% 10.2% -0.5% 8.8% 11.2%
Operating return $650 $833 $939 $521 $752 $1,148
Equity excluding
AOCI(1) $7,022 $7,927 $7,988 $7,722 $8,208 $9,769
Less
adjustments(2) 309 273 59 — — 455
Operating equity
excluding AOCI $6,713 $7,654 $7,929 $7,722 $8,208 $9,314
Operating
return on equity
excluding AOCI
9.7% 10.9% 11.8% 6.7% 9.2% 12.3%
(1) Equity excluding AOCI is calculated using a ve point average of quarter-end Ameriprise Financial
shareholders’ equity excluding AOCI for the last ve quarters.
(2) Adjustments for 2005, 2006 and 2007 reect a ve point average of quarter-end assets and
liabilities of discontinued operations and equity allocated to expected separation costs as of the
last day of the preceding four quarters and the current quarter. The adjustment for 2010 reects
a ve point average of appropriated retained earnings of the CIEs for the last ve quarters.
(in millions) 2005 2010
Advice & Wealth Management and Asset Management
Pretax segment income $195 $619
Realized (gains) losses 11 (4)
Integration charges — 102
Pretax operating earnings $206 $717
Annuities and Protection
Pretax segment income $984 $1,052
Realized (gains) losses (50) (10)
AMEX Assurance (82) —
Pretax operating earnings $852 $1,042
Percent pretax segment operating earnings from high
capital businesses 81% 59%
Percent pretax segment operating earnings from low
capital businesses 19% 41%