Alpine 2016 Annual Report Download - page 6
Download and view the complete annual report
Please find page 6 of the 2016 Alpine annual report below. You can navigate through the pages in the report by either clicking on the pages listed below, or by using the keyword search tool below to find specific information within the annual report.-
 1
1 -
 2
2 -
 3
3 -
 4
4 -
 5
5 -
 6
6 -
 7
7 -
 8
8 -
 9
9 -
 10
10 -
 11
11 -
 12
12 -
 13
13 -
 14
14 -
 15
15 -
 16
16 -
 17
17 -
18
-
19
 |
 |

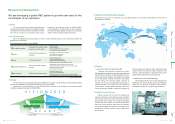
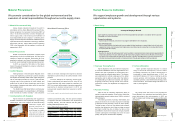
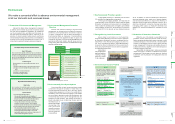
■Financial/Non-nancial Highlights
Weoeranoverviewofourbusinessinscal2015below.
Business Report
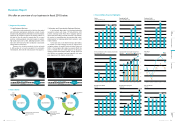
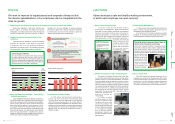
■Segment Information
●AudioEquipmentBusiness
Salesof ouraudioequipmentforboththeafter-market
and automobile manufacturers declined as a result of audio
functions being integrated into information and communication
equipmentlike navigationsystemsanddisplayproducts.In
themidstofthis,weworkedto expandsalesofoursound
systems,including speakersandampsfocusedonrealistic,
highqualitysound,andourslim,lightweightspeakers,which
have been well-received for their contribution to automobile
mileage and the environment.
However,the situationremaineddiredueprimarily
tofallingsalesofouraudioequipment forautomobile
manufacturers,whicharethemainproductsinthissegment.
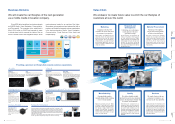
●InformationandCommunicationEquipmentBusiness
Inthedomesticafter-market,weintroducedautomobile
navigationsystemswithlarge,10”high-definitionLCD
screens and large-screen Rear Vision navigation systems
that we have been rolling out ahead of the rest of the industry.
We worked on expanding sales by proposing high value-
added systems for designing optimal interior spaces in each
model of vehicle.
Atthesametime,intheNorthAmericanafter-market,
we shifted to a sales strategy focused on large-screen
navigationsystemsfor specicmodelsofpickuptrucksand
SUVs.In theEuropeanafter-market,wepouredeortsinto
sales of models that were rated highly by the European
Imaging and Sound Association (EISA). Through these and
otherefforts,wepromotedoverseasexpansion,butsales
werestagnant,andthesituationremaineddire.
Sales ¥52.8 billion
Forecast for next year ¥51.0 billion
(3.2% decrease year on year)
Decrease of
16.0%
year on year
Sales ¥220.2 billion
Forecast for next year ¥202.9 billion
(4.1% decrease year on year)
Decrease of
4.9%
year on year
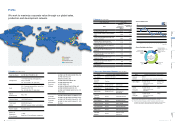
■Sales Ratios
By segment By destination By region
Audio
equipment
business
19%
Alpine brand
after-market
business
16%
Japan
11%
North America
37%
Asia/Other
13%
Information and communications
equipment business
81%
Audio equipment
business for automobile
manufacturers
84%
Europe
39%
0
20
Ordinary Profit
(Unit: Hundred millions of yen)
3/2012 3/2013 3/2014 3/2015 3/2016
40
60
80
100
120
140
160
2020 20
20
25
25
30
30 3030
0
5
Dividend per Share
(Unit: Yen)
3/2012 3/2013 3/2014 3/2015 3/2016
10
15
20
25
30
35
(Unit: People)
Number of Employees
3/2012 3/2013 3/2014 3/2015 3/2016
10,600
11,000
10,800
11,200
11,400
11,600
11,800
12,000
11,05811,058
11,10711,107
11,60811,608
11,34311,343
11,90811,908
4545
92
92
127
127
106
106
0
20
Net Income Attributable to Parent Company Shareholders
(Unit: Hundred millions of yen)
3/2012 3/2013 3/2014 3/2015 3/2016
3/2012 3/2013 3/2014 3/2015 3/2016
40
60
80
100
120
140
1717
65
65
0
20
Operating Profit
(Unit: Hundred millions of yen)
3/2012 3/2013 3/2014 3/2015 3/2016
40
60
80
100
120
140
5656
2323
9898
115115
5454
117
117
150
150
61
61
42
42
0
Sales
(Unit: Hundred millions of yen)
3/2012 3/2013 3/2014 3/2015 3/2016
500
1,000
1,500
2,000
2,500
3,000
3,500
2,0292,029
2,858
2,858 2,945
2,945
2,730
2,730
2,223
2,223
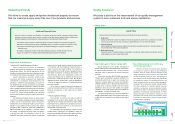
0
1.7
1.7
5.1
5.1 5.1
5.1
1.0
1.0
4.64.6
7.9
7.9
9.5
9.5
6.3
6.3 7.5
7.5
2.8
2.8
ROE/ROA
(Unit: %)
3/2012 3/2013 3/2014 3/2015 3/2016
10.0
8.0
6.0
4.0
2.0
■ROE
■ROA
CO₂ Emissions
(Unit: Tons)
3/2012 3/2013 3/2014 3/2015 3/2016
0
1,000
2,000
3,000
4,000
5,000
6,000
3,8213,821
3,568
3,568 3,507
3,507
4,790
4,790 4,592
4,592
69.269.2
1,6731,673
1,0181,018
1,6801,680
1,0991,099
1,9061,906
1,2521,252
2,1132,113
1,4421,442
2,0512,051
1,4381,438
Total Assets/Net Assets/Capital Adequacy Ratio
(Unit: Hundred
millions of yen)
2,500
2,000
1,500
1,000
500
0
70.0
68.0
66.0
64.0
62.0
60.0
56.0
58.0
64.964.9
65.165.1
67.467.4
60.460.4
■Total Assets■Net Assets■Capital Adequacy Ratio
10 Annual Report 2016-2017 11
Annual Report 2016-2017
ESGEorts
Financial
Data
Top
Message Overview of Alpine Business Report