Alpine 2012 Annual Report Download - page 6
Download and view the complete annual report
Please find page 6 of the 2012 Alpine annual report below. You can navigate through the pages in the report by either clicking on the pages listed below, or by using the keyword search tool below to find specific information within the annual report.-
 1
1 -
 2
2 -
 3
3 -
 4
4 -
 5
5 -
 6
6 -
 7
7 -
 8
8 -
 9
9 -
 10
10 -
 11
11 -
 12
12 -
 13
13 -
 14
14 -
 15
15 -
 16
16 -
 17
17 -
18
-
19
-
20
-
21
-
22
 |
 |

- 5 -
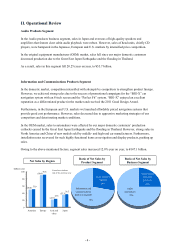
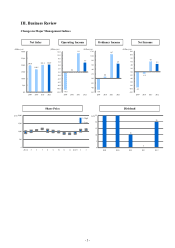
III. Business Review
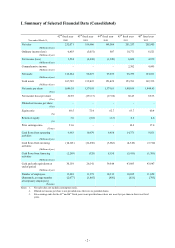
Changes in Major Management Indices
Net Sales Operating Income Ordinary Income Net Income
Share Price Dividend
196.6
168.5
201.2 202.9
0.0
50.0
100.0
150.0
200.0
250.0
300.0
2009 2010 2011 2012
(billion yen)
-10.6
0.2
11.1
5.6
-12.0
-10.0
-8.0
-6.0
-4.0
-2.0
0.0
2.0
4.0
6.0
8.0
10.0
12.0
2009 2010 2011 2012
(billion yen)
-5.0
0.8
10.7
6.5
-6.0
-4.0
-2.0
0.0
2.0
4.0
6.0
8.0
10.0
12.0
2009 2010 2011 2012
(billion yen)
-9.2
-1.2
6.0
4.5
-12.0
-10.0
-8.0
-6.0
-4.0
-2.0
0.0
2.0
4.0
6.0
8.0
10.0
12.0
2009 2010 2011 2012
(billion yen)
0
500
1,000
1,500
2,000
2011/4 5 6 7 8 9 10 11 12 2012/1 2 3
(yen)
High
Low
10
0
20
25
25
0
5
10
15
20
25
20082009201020112012
(yen)