Alpine 2012 Annual Report Download - page 3
Download and view the complete annual report
Please find page 3 of the 2012 Alpine annual report below. You can navigate through the pages in the report by either clicking on the pages listed below, or by using the keyword search tool below to find specific information within the annual report.-
 1
1 -
 2
2 -
 3
3 -
 4
4 -
 5
5 -
 6
6 -
 7
7 -
 8
8 -
 9
9 -
 10
10 -
 11
11 -
 12
12 -
 13
13 -
 14
14 -
15
-
16
-
17
-
18
-
19
-
20
-
21
-
22
 |
 |

- 2 -
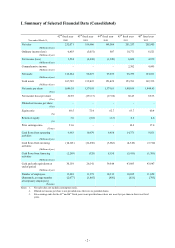
I. Summary of Selected Financial Data (Consolidated)
42nd fiscal year 43rd fiscal year 44th fiscal year 45th fiscal year 46th fiscal year
Year ended March 31, 2008 2009 2010 2011 2012
Net sales
(Millions of yen)
252,071 196,666 168,586 201,257 202,905
Ordinary income (loss)
(Millions of yen)
6,403 (5,051) 807 10,771 6,521
Net income (loss)
(Millions of yen)
3,554 (9,290) (1,249) 6,029 4,572
Comprehensive income
(Millions of yen)
– – – 2,382 4,445
Net assets
(Millions of yen)
116,264 96,873 97,035 98,759 101,811
Total assets
(Millions of yen)
167,785 132,422 153,428 153,783 167,355
Net assets per share
(Yen)
1,646.38 1,374.95 1,379.61 1,403.69 1,448.63
Net income (loss) per share
(Yen)
50.95 (133.17) (17.92) 86.43 65.53
Diluted net income per share
(Yen)
–––– –
Equity ratio
(%)
68.5 72.4 62.7 63.7 60.4
Return on equity
(%)
3.0 (8.8) (1.3) 6.2 4.6
Price earnings ratio
(Times)
21.6 – – 10.8 17.0
Cash flows from operating
activities
(Millions of yen)
9,963 10,679 9,858 14,371 9,921
Cash flows from investing
activities
(Millions of yen)
(14,101) (12,850) (3,962) (4,349) (7,710)
Cash flows from financing
activities
(Millions of yen)
(2,289) (329) 8,150 (5,411) (1,381)
Cash and cash equivalents at
end of period
(Millions of yen)
30,159 26,141 39,844 43,883 43,947
Number of employees
[Separately, average number
of temporary employees]
(Persons)
13,403
[2,077]
11,573
[1,865]
10,913
[456]
10,835
[621]
11,058
[703]
Notes: 1. Net sales does not include consumption taxes.
2. Diluted net income per share is not provided since there are no potential shares.
3. Price earnings ratio for the 43rd and 44th fiscal years is not provided since there was a net loss per share in those two fiscal
years.