Air New Zealand 2012 Annual Report Download - page 7
Download and view the complete annual report
Please find page 7 of the 2012 Air New Zealand annual report below. You can navigate through the pages in the report by either clicking on the pages listed below, or by using the keyword search tool below to find specific information within the annual report.-
 1
1 -
 2
2 -
 3
3 -
 4
4 -
 5
5 -
 6
6 -
 7
7 -
 8
8 -
 9
9 -
 10
10 -
 11
11 -
 12
12 -
 13
13 -
 14
14 -
 15
15 -
 16
16 -
 17
17 -
 18
18 -
19
-
20
-
21
-
22
-
23
-
24
-
25
-
26
-
27
-
28
-
29
-
30
-
31
-
32
-
33
-
34
-
35
-
36
-
37
-
38
-
39
-
40
-
41
-
42
-
43
-
44
-
45
-
46
-
47
-
48
-
49
-
50
-
51
-
52
-
53
-
54
-
55
-
56
-
57
-
58
-
59
-
60
-
61
-
62
-
63
-
64
-
65
-
66
-
67
-
68
-
69
-
70
-
71
-
72
-
73
-
74
-
75
-
76
 |
 |

AIR NEW ZEALAND ANNUAL FINANCIAL RESULTS 2012
5
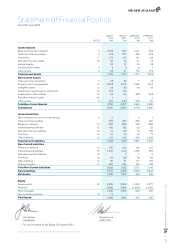
The accompanying accounting policies and notes form part of these financial statements.
NOTES
GROUP
2012
$M
GROUP
2 011
$M
COMPANY
2012
$M
COMPANY
2 011
$M
Current Assets
Bank and short term deposits 5 1,029 860 1,021 852
Trade and other receivables 6 374 377 335 326
Inventories 7 170 167 141 136
Derivative financial assets 18 40 13 41 14
Income taxation 20 14 49 56
Assets held for resale 8 9 3 8 1
Other assets 9 58 41 176 419
Total Current Assets 1,700 1,475 1,771 1,804
Non-Current Assets
Trade and other receivables 6 48 52 7 13
Property, plant and equipment 10 3,092 2,714 1,968 1,519
Intangible assets 11 63 56 54 49
Investment in quoted equity instruments 12 203 120 - -
Investments in other entities 13 60 54 408 285
Derivative financial assets 18 1 1 1 2
Other assets 9 292 430 525 417
Total Non-Current Assets 3,759 3,427 2,963 2,285
Total Assets 5,459 4,902 4,734 4,089
Current Liabilities
Bank overdraft and short term borrowings 5 2 - 6 1
Trade and other payables 373 369 332 331
Revenue in advance 14 902 888 893 868
Interest-bearing liabilities 15 155 152 83 53
Derivative financial liabilities 18 14 166 15 168
Provisions 16 61 79 60 77
Other liabilities 19 176 162 862 1,033
Total Current Liabilities 1,683 1,816 2, 251 2,531
Non-Current Liabilities
Revenue in advance 14 135 122 134 122
Interest-bearing liabilities 15 1,537 1,103 1,039 555
Derivative financial liabilities 18 - 7 1 9
Provisions 16 94 88 94 88
Other liabilities 19 25 31 117 105
Deferred taxation 21 297 231 190 133
Total Non-Current Liabilities 2,088 1,582 1,575 1,012
Total Liabilities 3,771 3,398 3,826 3,543
Net Assets 1,688 1,504 908 546
Equity
Issued capital 22 2,282 2,269 2,290 2,277
Reserves (596) (765) (1,382) (1,731)
Parent interests 1,686 1,504 908 546
Non-controlling interests 13 2 - - -
Total Equity 1,688 1,504 908 546
John Palmer Roger France
CHAIRMAN DIRECTOR
For and on behalf of the Board, 30 August 2012
Statement 0f Financial Position
As at 30 June 2012