Air New Zealand 2012 Annual Report Download - page 54
Download and view the complete annual report
Please find page 54 of the 2012 Air New Zealand annual report below. You can navigate through the pages in the report by either clicking on the pages listed below, or by using the keyword search tool below to find specific information within the annual report.-
 1
1 -
2
-
3
-
4
-
5
-
6
-
7
-
8
-
9
-
10
-
11
-
12
-
13
-
14
-
15
-
16
-
17
-
18
-
19
-
20
-
21
-
22
-
23
-
24
-
25
-
26
-
27
-
28
-
29
-
30
-
31
-
32
-
33
-
34
-
35
-
36
-
37
-
38
-
39
-
40
-
41
-
42
-
43
-
 44
44 -
 45
45 -
 46
46 -
 47
47 -
 48
48 -
 49
49 -
 50
50 -
 51
51 -
 52
52 -
 53
53 -
 54
54 -
 55
55 -
 56
56 -
 57
57 -
 58
58 -
 59
59 -
 60
60 -
 61
61 -
 62
62 -
 63
63 -
 64
64 -
65
-
66
-
67
-
68
-
69
-
70
-
71
-
72
-
73
-
74
-
75
-
76
 |
 |

AIR NEW ZEALAND ANNUAL FINANCIAL RESULTS 2012
52
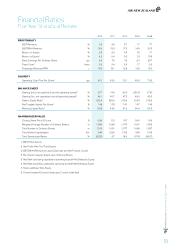
Historical Summary of Financial Position
Five Year Statistical Review
As at 30 June
2012
$M
2 011
$M
2010
$M
2009
$M
2008
$M
Current Assets
Bank and short term deposits 1,029 860 1,067 1,573 1,289
Other current assets 671 615 621 702 823
Total Current Assets 1,700 1,475 1,688 2,275 2 ,112
Non-Current Assets
Property, plant and equipment 3,092 2,714 2,230 2,337 2,534
Other non-current assets 667 713 679 433 377
Total Non-Current Assets 3,759 3,427 2,909 2,770 2 , 911
Total Assets 5,459 4,902 4,597 5,045 5,023
Current Liabilities
Net debt1 157 152 175 172 158
Other current liabilities 1,526 1,664 1,432 1,587 1,549
Total Current Liabilities 1,683 1,816 1,607 1,759 1,707
Non-Current Liabilities
Net debt1 1,537 1,103 900 1,107 1,167
Other non-current liabilities 551 479 524 574 572
Total Non-Current Liabilities 2,088 1,582 1,424 1,681 1,739
Total Liabilities 3,771 3,398 3,031 3,440 3,446
Net Assets 1,688 1,504 1,566 1,605 1,577
Total Equity 1,688 1,504 1,566 1,605 1,577
1. Net debt is comprised of bank overdraft, borrowings, bonds and finance lease liabilities.
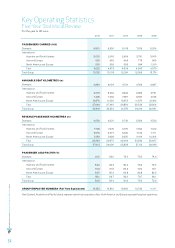
Historical Summary of Cash Flows
For the year to 30 June
2012
$M
2 011
$M
2010
$M
2009
$M
2008
$M
Cash flow from operating activities 472 466 334 486 74 3
Cash flow from investing activities (654) (846) (450) (216) (290)
Cash flow from financing activities 349 173 (390) 14 (221)
Increase/(decrease) in cash holding 167 (207) (506) 284 232
Total cash and cash equivalents 1,027 860 1,067 1,573 1,289