Air New Zealand 2012 Annual Report Download - page 47
Download and view the complete annual report
Please find page 47 of the 2012 Air New Zealand annual report below. You can navigate through the pages in the report by either clicking on the pages listed below, or by using the keyword search tool below to find specific information within the annual report.-
 1
1 -
2
-
3
-
4
-
5
-
6
-
7
-
8
-
9
-
10
-
11
-
12
-
13
-
14
-
15
-
16
-
17
-
18
-
19
-
20
-
21
-
22
-
23
-
24
-
25
-
26
-
27
-
28
-
29
-
30
-
31
-
32
-
33
-
34
-
35
-
36
-
 37
37 -
 38
38 -
 39
39 -
 40
40 -
 41
41 -
 42
42 -
 43
43 -
 44
44 -
 45
45 -
 46
46 -
 47
47 -
 48
48 -
 49
49 -
 50
50 -
 51
51 -
 52
52 -
 53
53 -
 54
54 -
 55
55 -
 56
56 -
 57
57 -
58
-
59
-
60
-
61
-
62
-
63
-
64
-
65
-
66
-
67
-
68
-
69
-
70
-
71
-
72
-
73
-
74
-
75
-
76
 |
 |

AIR NEW ZEALAND ANNUAL FINANCIAL RESULTS 2012
45
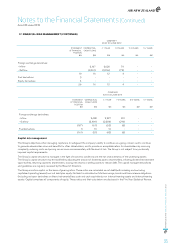
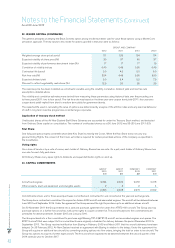
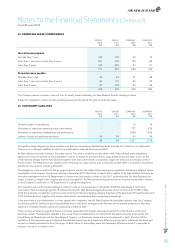
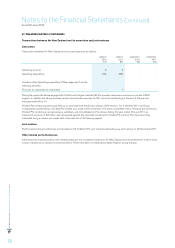
26. RETIREMENT BENEFIT OBLIGATIONS (CONTINUED)
GROUP AND COMPANY
2012
$M
2 011
$M
Fair value of plan assets at the beginning of the year 110 100
Expected return on plan assets 6 5
Contributions by employer 5 5
Contributions by participants 2 2
Actuarial (losses)/gains (3) 1
Benefits paid (6) (3)
Settlements (1) -
Fair value of plan assets at the end of the year 113 110
The Group expects to contribute approximately $8 million to its defined benefit plans in 2013.
GROUP AND COMPANY
2012
$M
2 011
$M
Major categories of plan assets:
Fixed interest unit fund 54% 55%
Property unit fund 8% 8%
New Zealand equity unit fund 7% 7%
Overseas equity unit fund 25% 24%
Commodities fund 3% 3%
Other assets 3% 3%
100% 100%
None of the above relate to the Company’s own financial instruments, nor property occupied by or other assets used by the Company.
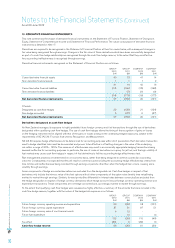
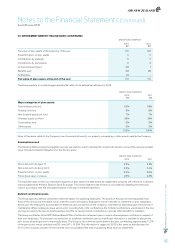
Assumptions used
The following table provides the weighted average assumptions used to develop the net periodic pension cost and the actuarial present
value of projected benefit obligations for the Group’s plans:
GROUP AND COMPANY
2012 2 011
Gross discount rate (year 1) 2.2% 2.5%
Gross discount rate (long term) 5.2% 5.1%
Expected return on plan assets 3.9% 5.0%
Future base salary increases 2.5% 2.5%
The expected rates of return on individual categories of plan assets are determined by independent actuaries with reference to relevant
indices published by the New Zealand Stock Exchange. The overall expected rate of return is calculated by weighting the individual
rates in accordance with the anticipated balance in the plan’s investment portfolio.
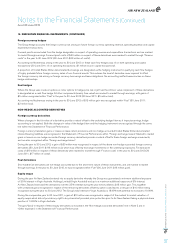
Defined contribution plans
The Group operates defined contribution retirement plans for qualifying employees. The assets of the plan are held separately from
those of the Group and invested in funds under the control of trustees. Employees receive a benefit on retirement or upon resignation,
based upon the employee’s accumulated contributions plus a proportion of the company’s contributions depending upon their period of
membership. Where employees leave service prior to vesting fully in the contributions, the forfeited contributions are retained in the plan
and may be used by the plan to meet expenses, fund the company’s future contributions or provide other benefits for members.
The Group contributes to the NPF Defined Benefit Plan Contributors retirement plan, to which other employers contribute in respect of
their own employees. This has been accounted for as a defined contribution plan as insufficient information is available to allocate the
plan across all participants on a meaningful basis. The Group is not a dominant participant in the plan, contributing approximately 11.3%
of the plan’s total annual contributions (30 June 2011: 10.2%). The information in respect of 2012 is the same as that disclosed for
2011 as the actuarial valuation for the scheme was not available at the time of preparing these financial statements.
Notes to the Financial Statements (Continued)
As at 30 June 2012