Air Canada 2014 Annual Report Download - page 2
Download and view the complete annual report
Please find page 2 of the 2014 Air Canada annual report below. You can navigate through the pages in the report by either clicking on the pages listed below, or by using the keyword search tool below to find specific information within the annual report.-
 1
1 -
 2
2 -
 3
3 -
 4
4 -
 5
5 -
 6
6 -
 7
7 -
 8
8 -
 9
9 -
 10
10 -
 11
11 -
 12
12 -
 13
13 -
14
-
15
-
16
-
17
-
18
-
19
-
20
-
21
-
22
-
23
-
24
-
25
-
26
-
27
-
28
-
29
-
30
-
31
-
32
-
33
-
34
-
35
-
36
-
37
-
38
-
39
-
40
-
41
-
42
-
43
-
44
-
45
-
46
-
47
-
48
-
49
-
50
-
51
-
52
-
53
-
54
-
55
-
56
-
57
-
58
-
59
-
60
-
61
-
62
-
63
-
64
-
65
-
66
-
67
-
68
-
69
-
70
-
71
-
72
-
73
-
74
-
75
-
76
-
77
-
78
-
79
-
80
-
81
-
82
-
83
-
84
-
85
-
86
-
87
-
88
-
89
-
90
-
91
-
92
-
93
-
94
-
95
-
96
-
97
-
98
-
99
-
100
-
101
-
102
-
103
-
104
-
105
-
106
-
107
-
108
-
109
-
110
-
111
-
112
-
113
-
114
-
115
-
116
-
117
-
118
-
119
-
120
-
121
-
122
-
123
-
124
-
125
-
126
-
127
-
128
-
129
-
130
-
131
-
132
-
133
-
134
-
135
-
136
-
137
-
138
-
139
-
140
 |
 |

2
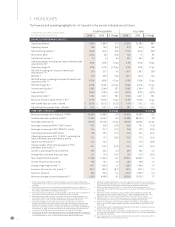
1. HIGHLIGHTS
The financial and operating highlights for Air Canada for the periods indicated are as follows.
CANADIAN DOLLARS IN MILLIONS,
EXCEPT WHERE INDICATED
FOURTH QUARTER FULL YEAR
2014 2013 $ Change 2014 2013 $ Change
FINANCIAL PERFORMANCE METRICS
Operating revenues 3,104 2,894 210 13,272 12,382 890
Operating income 106 135 (29) 815 619 196
Non-operating expense (1) (206) (141) (65) (710) (617) (93)
Net income (loss) (100) (6) (94) 105 10 95
Adjusted net income (2) 67 3 64 531 340 191
Operating margin, excluding the impact of benefit plan
amendments % (3) 3.4% 1.8% 1.6 pp 6.1% 4.3% 1.8 pp
Operating margin % 3.4% 4.7% (1.3) pp 6.1% 5.0% 1.1 pp
EBITDAR, excluding the impact of benefit plan
amendments (3)(4) 319 277 42 1,671 1,433 238
EBITDAR (4) 319 359 (40) 1,671 1,515 156
EBITDAR margin, excluding the impact of benefit plan
amendments % (3)(4) 10.3% 9.6% 0.7 pp 12.6% 11.6% 1.0 pp
EBITDAR margin % (4) 10.3% 12.4% (2.1) pp 12.6% 12.2% 0.4 pp
Unrestricted liquidity (5) 2,685 2,364 321 2,685 2,364 321
Free cash flow (6) (366) (276) (90) (560) (231) (329)
Adjusted net debt (7) 5,132 4,351 781 5,132 4,351 781
Return on invested capital (“ROIC”) % (8) 12.1% 10.5% 1.6 pp 12.1% 10.5% 1.6 pp
Net income (loss) per share – diluted $ (0.35) $ (0.02) $ (0.33) $ 0.34 $ 0.02 $ 0.32
Adjusted net income per share – diluted (2) $ 0.23 $ 0.01 $ 0.22 $ 1.81 $ 1.20 $ 0.61
OPERATING STATISTICS (9) % Change % Change
Revenue passenger miles (millions) (“RPM”) 14,090 12,883 9.4 61,616 56,791 8.5
Available seat miles (millions) (“ASM”) 17,403 16,033 8.5 73,889 68,573 7.8
Passenger load factor % 81.0% 80.3% 0.6 pp 83.4% 82.8% 0.6 pp
Passenger revenue per RPM (“Yield”) (cents) 19.2 19.6 (1.9) 18.9 19.1 (1.3)
Passenger revenue per ASM (“PRASM”) (cents) 15.6 15.7 (1.2) 15.8 15.9 (0.6)
Operating revenue per ASM (cents) 17.8 18.1 (1.2) 18.0 18.1 (0.5)
Operating expense per ASM (“CASM”), excluding the
impact of benefit plan amendments (cents) 17.2 17.7 (2.8) 16.9 17. 3 (2.4)
Adjusted CASM (cents) (10) 12.1 12.1 - 11.3 11.6 (2.6)
Average number of full-time equivalent (“FTE”)
employees (thousands) (11) 24.1 24.2 (0.3) 24.4 24.5 (0.4)
Aircraft in operating fleet at period-end 364 352 3.4 364 352 3.4
Average fleet utilization (hours per day) 9.2 9.4 (1.4) 9.9 10.0 (0.9)
Seats dispatched (thousands) 11,948 11,246 6.2 49,351 46,832 5.4
Aircraft frequencies (thousands) 135 131 2.9 555 548 1.3
Average stage length (miles) (12) 1,457 1,426 2.2 1,497 1,464 2.3
Economic fuel cost per litre (cents) (13) 80.7 88.4 (8.7) 89.3 89.0 0.3
Fuel litres (millions) 992 943 5.2 4,213 3,993 5.5
Revenue passengers carried (thousands) (14) 9,189 8,499 8.1 38,526 35,761 7.7
1 In the third quarter of 2013, Air Canada recorded an interest charge of $95 million
related to the purchase of its senior secured notes which were to become due in 2015
and 2016.
2 Adjusted net income (loss) and adjusted net income (loss) per share – diluted are
non-GAAP financial measures. Refer to section 20 “Non-GAAP Financial Measures” of
Air Canada’s 2014 MD&A for additional information.
3 In the fourth quarter of 2013, Air Canada recorded an operating expense reduction of
$82 million related to amendments to defined benefit pension plans.
4 EBITDAR (earnings before interest, taxes, depreciation, amortization, impairment
and aircraft rent) is a non-GAAP financial measure. Refer to section 20 “Non-GAAP
Financial Measures” of Air Canada’s 2014 MD&A for additional information.
5 Unrestricted liquidity refers to the sum of cash, cash equivalents, short-term
investments and the amount of available credit under Air Canada’s revolving credit
facilities. At December 31, 2014, unrestricted liquidity was comprised of cash and
short-term investments of $2,275 million and undrawn lines of credit of $410 million.
At December 31, 2013, unrestricted liquidity was comprised of cash and short-term
investments of $2,208 million and undrawn lines of credit of $156 million.
6 Free cash flow (cash flows from operating activities less additions to property, equipment
and intangible assets) is a non-GAAP financial measure. Refer to section 9.5 “Consolidated
Cash Flow Movements” of Air Canada’s 2014 MD&A for additional information.
7 Adjusted net debt (total debt less cash, cash equivalents and short-term investments
plus capitalized operating leases) is a non-GAAP financial measure. Refer to section 9.3
“Adjusted Net Debt” of Air Canada’s 2014 MD&A for additional information.
8 Return on invested capital (“ROIC”) is a non-GAAP financial measure. Refer to
section 20 “Non-GAAP Financial Measures” of Air Canada’s 2014 MD&A for additional
information.
9 Operating statistics (except for average number of FTE employees) include third
party carriers (such as Jazz Aviation LP (“Jazz”) and Sky Regional Airlines Inc. (“Sky
Regional”)) operating under capacity purchase agreements with Air Canada.
10 Adjusted CASM is a non-GAAP financial measure. Refer to section 20 “Non-GAAP
Financial Measures” of Air Canada’s 2014 MD&A for additional information.
11 Reflects FTE employees at Air Canada. Excludes FTE employees at third party carriers
(such as Jazz and Sky Regional) operating under capacity purchase agreements with
Air Canada.
12 Average stage length is calculated by dividing the total number of available seat miles
by the total number of seats dispatched.
13 Includes fuel handling expenses. Economic fuel price per litre is a non-GAAP financial
measure. Refer to sections 6 and 7 “Results of Operations” of Air Canada’s 2014 MD&A
for additional information.
14 Revenue passengers are counted on a flight number basis which is consistent with the
IATA definition of revenue passengers carried.