Adidas 1999 Annual Report Download - page 13
Download and view the complete annual report
Please find page 13 of the 1999 Adidas annual report below. You can navigate through the pages in the report by either clicking on the pages listed below, or by using the keyword search tool below to find specific information within the annual report.-
 1
1 -
2
-
 3
3 -
 4
4 -
 5
5 -
 6
6 -
 7
7 -
 8
8 -
 9
9 -
 10
10 -
 11
11 -
 12
12 -
 13
13 -
 14
14 -
 15
15 -
 16
16 -
 17
17 -
 18
18 -
 19
19 -
 20
20 -
 21
21 -
 22
22 -
 23
23 -
24
-
25
-
26
-
27
-
28
-
29
-
30
-
31
-
32
-
33
-
34
-
35
-
36
-
37
-
38
-
39
-
40
-
41
-
42
-
43
-
44
-
45
-
46
-
47
-
48
-
49
-
50
-
51
-
52
-
53
-
54
-
55
-
56
-
57
-
58
-
59
-
60
-
61
-
62
-
63
-
64
-
65
-
66
-
67
-
68
-
69
-
70
-
71
-
72
-
73
-
74
-
75
-
76
-
77
-
78
-
79
-
80
-
81
-
82
-
83
-
84
-
85
-
86
-
87
-
88
-
89
-
90
-
91
-
92
-
93
-
94
 |
 |

9
Management Discussion and Analysis
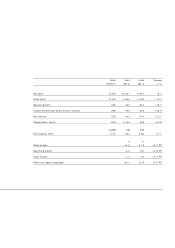
Total assets increased,
new financing
instruments used,
equity ratio significantly
improved
Total assets of the adidas-Salomon Group in 1999 in-
creased by DM 746 million or 12%. On the assets side,
trade accounts receivable showed an overproportional
increase of 29%, which was related to growth in busi-
ness volume, partly of adidas Japan, but also resulted
in part from higher currency exchange rates. If the
exchange rates of the Deutsche Mark had remained
unchanged in 1999, trade accounts receivable would
have shown an increase of only 17%.
Year-end inventories in 1999 were 7% up compared to
the prior year. This increase is slightly higher than the
growth in order backlog but is in line with the Group’s
objective to maintain a close correlation between inven-
tories and order backlogs. Changes in currency ratios
also impacted inventories. If the exchange rates of
the Deutsche Mark had remained unchanged in 1999,
inventories would have been reduced by around 2%.
Current assets rose by 14% in total.
Fixed assets increased by 16%, impacted by the ex-
pansion of the new “ World of Sports” headquarters in
Herzogenaurach and by investments in state-of-the-art
IT technology. These investments partly served to handle
the “ Year 2000 issue” but were also needed in order to
harmonize and accelerate the implementation of sys-
tems and achieve savings in logistics expenses.
As a result of the reformulation of the equity covenant
in the medium-term credit agreements, borrowings
under these agreements are now reported under long-
term borrowings.
As at December 31, 1999, credit lines amounted to
a total of DM 7.0 billion. This amount includes com-
mitted medium-term credit lines and other longer-term
financing arrangements in a total of DM 2.9 billion.
These credit lines have maturities between 2001 and
2008. More than half of these lines have maturities
from the end of 2003 or later. The total of long-term
financing facilities increased by DM 600 million in
1999. In the majority of cases, adidas-Salomon takes up
short-term loans, in order to take advantage of the gen-
erally lower short-term interest rates. Interest rate caps
for the protection against interest rate risk amounted to
DM 2.9 billion at the end of 1999. Since the beginning
of 2000, adidas-Salomon has arranged additional caps
with maturities in 2005 and 2006, to replace caps
expiring in 2000 and 2001.
At the beginning of 1999, adidas-Salomon had com-
menced a Treasury Notes Program in Belgium in the
amount of Euro 150 million. Substantial investor interest
in this program subsequently led to the volume being
doubled. In January 2000, adidas-Salomon additionally
set up a Commercial Paper Program in Germany in the
amount of Euro 750 million, which was highly success-
ful from the start. The introduction of a Medium-Term
Notes Program is planned for the end of the year 2000.
All these activities serve to diversify further the financ-
ing instruments used.
The equity base was considerably strengthened in
1999. Equity rose by 47% to DM 1.3 billion as the
major share of net income was retained within the Group
and was thus used to strengthen the equity base. The
equity ratio rose by 4.6 percentage points to 19.0%.
Financial leverage, the ratio of net borrowings to equity,
decreased by 123 percentage points to 234%.
1995 1996 1997 1998 1999*
DIVIDEND
(DM per share)
2.00
1.50
1.00
0.50
* proposal
1995 1996 1997 1998 1999
EQUITY RATIO
(in % of total assets)
n
n
n
n
n
40
35
30
25
20
15