Adidas 1999 Annual Report Download - page 12
Download and view the complete annual report
Please find page 12 of the 1999 Adidas annual report below. You can navigate through the pages in the report by either clicking on the pages listed below, or by using the keyword search tool below to find specific information within the annual report.-
 1
1 -
 2
2 -
 3
3 -
 4
4 -
 5
5 -
 6
6 -
 7
7 -
 8
8 -
 9
9 -
 10
10 -
 11
11 -
 12
12 -
 13
13 -
 14
14 -
 15
15 -
 16
16 -
 17
17 -
 18
18 -
 19
19 -
 20
20 -
 21
21 -
 22
22 -
23
-
24
-
25
-
26
-
27
-
28
-
29
-
30
-
31
-
32
-
33
-
34
-
35
-
36
-
37
-
38
-
39
-
40
-
41
-
42
-
43
-
44
-
45
-
46
-
47
-
48
-
49
-
50
-
51
-
52
-
53
-
54
-
55
-
56
-
57
-
58
-
59
-
60
-
61
-
62
-
63
-
64
-
65
-
66
-
67
-
68
-
69
-
70
-
71
-
72
-
73
-
74
-
75
-
76
-
77
-
78
-
79
-
80
-
81
-
82
-
83
-
84
-
85
-
86
-
87
-
88
-
89
-
90
-
91
-
92
-
93
-
94
 |
 |

8
Management Discussion and Analysis
The companies contributing to the result in 1999 other-
wise remained the same as in 1998. Excluding the
contribution from Japan from the previous year’s figures,
royalty and commission income remained virtually
unchanged.
Significant improvement
of financial result
Compared to the previous year (minus DM 224 million),
the financial result at minus DM 164 million improved
significantly in 1999, due to the non-recurrence of spe-
cial effects. In 1998, substantial expenses had been
incurred in connection with the instruments used for
currency hedging activities which secured a favorable
rate for US Dollar requirements in 1999. Additionally,
the Russian crisis had necessitated one-time provisions
and allowances in 1998. These burdens did not recur
in 1999.
During 1999, net borrowings were reduced slightly.
But
a strong US Dollar led to an increase in the DM value
of US Dollar denominated loans and a corresponding
increase in the interest burden for dollar-denominated
financing. Despite this development, in aggregate, these
factors led to a significant improvement of the financial
result.
Extraordinary income neutral on results
In 1999, as in the prior year, extraordinary income was
recorded. This amounted to DM 9 million (1998: DM 24
million) although it had no impact on income before
taxes as offsetting expenses of the same amount were
included in the selling, general and administrative ex-
penses. The expenses and extraordinary income were
directly related to a special reward and incentive plan
for Management which is sponsored by two individual
shareholders.
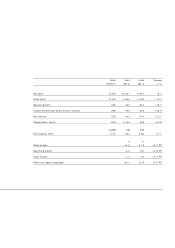
Income before taxes at record level
The significant improvement of the operating profit and
financial result drove income before taxes to a new all-
time high. DM 779 million represents an increase of
DM 155 million or 25% year-over-year and, additionally,
an improvement compared to the record result of 1997.
This is the best result the Group has ever achieved.
Earnings per share improved,
higher dividend proposed
Net income totaled DM 445 million, representing an
increase of DM 45 million or 11%. The significant im-
provement of income before taxes is not fully reflected
in net income due to an overproportional increase in tax
expenses and in minority interests. The tax rate rose by
5.4 percentage points to 38.4%. The main reasons for
this increase: The tax burden in 1998 was reduced as a
result of various one-off effects, which did not lead to
similar reductions in the 1999 fiscal year. Additionally,
changes in German tax legislation introduced in March
1999 resulted in an unavoidable increase in the tax rate
compared to the greatly reduced level of 1998.
Earnings per share in 1999 reached DM 9.82, rep-
resenting a year-over-year improvement (before special
effect in 1998) of DM 0.98 or 11%.
The Executive Board proposes a dividend of DM 1.80
per share. This represents a total payout of approximately
DM 82 million. The tax situation permits a full tax
credit
for German domestic shareholders with unlimited
tax lia
bility. With this proposal, the Executive Board
remains within the previously identified payout ratio of
between
15% and 20% of consolidated net income. The
dividend
paid for 1998 was DM 1.65.
1995 1996 1997 1998* 1999
PROFIT MARGIN ON TURNOVER
(%)
n
n
n
n
n
nbefore taxes
nnet
* before special effect
12
10
8
6
4
2
nnn
nn
1995 1996 1997 1998 1999
ROYALTY AND COMMISSION INCOME
(DM m)
120
100
80
60
40
20